

Download pdf guide - VSN International
Download pdf guide - VSN International
Download pdf guide - VSN International
- No tags were found...

Create successful ePaper yourself
Turn your PDF publications into a flip-book with our unique Google optimized e-Paper software.
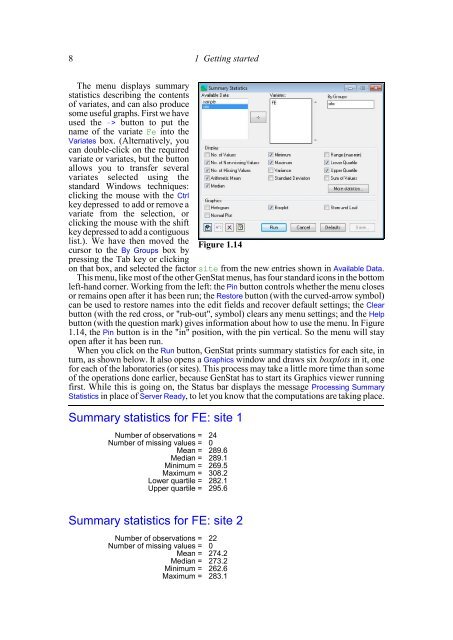
8 1 Getting startedThe menu displays summarystatistics describing the contentsof variates, and can also producesome useful graphs. First we haveused the > button to put thename of the variate Fe into theVariates box. (Alternatively, youcan double-click on the requiredvariate or variates, but the buttonallows you to transfer severalvariates selected using thestandard Windows techniques:clicking the mouse with the Ctrlkey depressed to add or remove avariate from the selection, orclicking the mouse with the shiftkey depressed to add a contiguouslist.). We have then moved theFigure 1.14cursor to the By Groups box bypressing the Tab key or clickingon that box, and selected the factor site from the new entries shown in Available Data.This menu, like most of the other GenStat menus, has four standard icons in the bottomleft-hand corner. Working from the left: the Pin button controls whether the menu closesor remains open after it has been run; the Restore button (with the curved-arrow symbol)can be used to restore names into the edit fields and recover default settings; the Clearbutton (with the red cross, or "rub-out", symbol) clears any menu settings; and the Helpbutton (with the question mark) gives information about how to use the menu. In Figure1.14, the Pin button is in the "in" position, with the pin vertical. So the menu will stayopen after it has been run.When you click on the Run button, GenStat prints summary statistics for each site, inturn, as shown below. It also opens a Graphics window and draws six boxplots in it, onefor each of the laboratories (or sites). This process may take a little more time than someof the operations done earlier, because GenStat has to start its Graphics viewer runningfirst. While this is going on, the Status bar displays the message Processing SummaryStatistics in place of Server Ready, to let you know that the computations are taking place.Summary statistics for FE: site 1Number of observations = 24Number of missing values = 0Mean = 289.6Median = 289.1Minimum = 269.5Maximum = 308.2Lower quartile = 282.1Upper quartile = 295.6Summary statistics for FE: site 2Number of observations = 22Number of missing values = 0Mean = 274.2Median = 273.2Minimum = 262.6Maximum = 283.1


