

Download pdf guide - VSN International
Download pdf guide - VSN International
Download pdf guide - VSN International
- No tags were found...

Create successful ePaper yourself
Turn your PDF publications into a flip-book with our unique Google optimized e-Paper software.
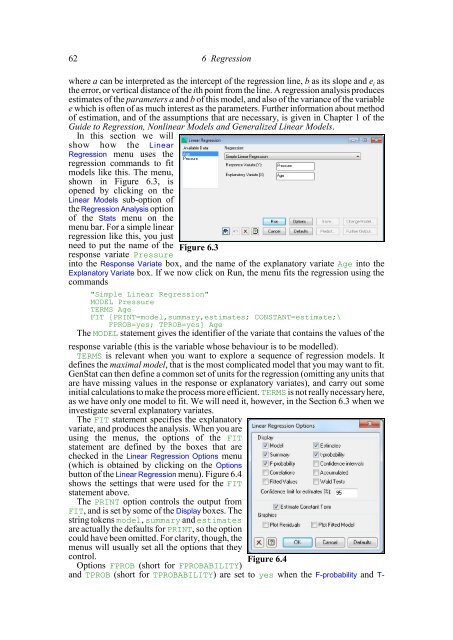
62 6 Regressionwhere a can be interpreted as the intercept of the regression line, b as its slope and e i asthe error, or vertical distance of the ith point from the line. A regression analysis producesestimates of the parameters a and b of this model, and also of the variance of the variablee which is often of as much interest as the parameters. Further information about methodof estimation, and of the assumptions that are necessary, is given in Chapter 1 of theGuide to Regression, Nonlinear Models and Generalized Linear Models.In this section we willshow how the LinearRegression menu uses theregression commands to fitmodels like this. The menu,shown in Figure 6.3, isopened by clicking on theLinear Models sub-option ofthe Regression Analysis optionof the Stats menu on themenu bar. For a simple linearregression like this, you justneed to put the name of theresponse variate PressureFigure 6.3into the Response Variate box, and the name of the explanatory variate Age into theExplanatory Variate box. If we now click on Run, the menu fits the regression using thecommands"Simple Linear Regression"MODEL PressureTERMS AgeFIT [PRINT=model,summary,estimates; CONSTANT=estimate;\FPROB=yes; TPROB=yes] AgeThe MODEL statement gives the identifier of the variate that contains the values of theresponse variable (this is the variable whose behaviour is to be modelled).TERMS is relevant when you want to explore a sequence of regression models. Itdefines the maximal model, that is the most complicated model that you may want to fit.GenStat can then define a common set of units for the regression (omitting any units thatare have missing values in the response or explanatory variates), and carry out someinitial calculations to make the process more efficient. TERMS is not really necessary here,as we have only one model to fit. We will need it, however, in the Section 6.3 when weinvestigate several explanatory variates.The FIT statement specifies the explanatoryvariate, and produces the analysis. When you areusing the menus, the options of the FITstatement are defined by the boxes that arechecked in the Linear Regression Options menu(which is obtained by clicking on the Optionsbutton of the Linear Regression menu). Figure 6.4shows the settings that were used for the FITstatement above.The PRINT option controls the output fromFIT, and is set by some of the Display boxes. Thestring tokens model, summary and estimatesare actually the defaults for PRINT, so the optioncould have been omitted. For clarity, though, themenus will usually set all the options that theycontrol.Figure 6.4Options FPROB (short for FPROBABILITY)and TPROB (short for TPROBABILITY) are set to yes when the F-probability and T-


