

Download pdf guide - VSN International
Download pdf guide - VSN International
Download pdf guide - VSN International
- No tags were found...

Create successful ePaper yourself
Turn your PDF publications into a flip-book with our unique Google optimized e-Paper software.
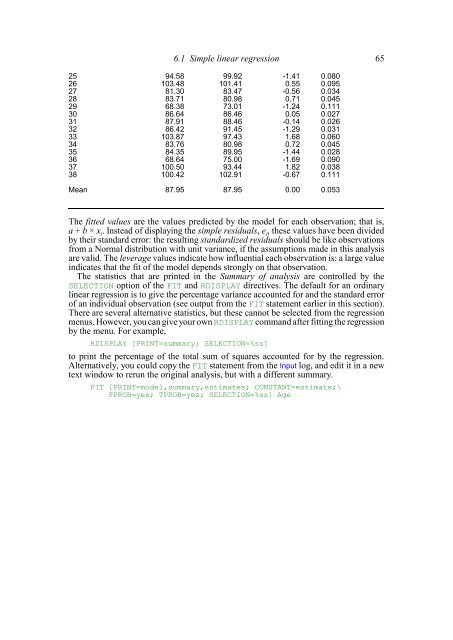
6.1 Simple linear regression 6525 94.58 99.92 -1.41 0.08026 103.48 101.41 0.55 0.09527 81.30 83.47 -0.56 0.03428 83.71 80.98 0.71 0.04529 68.38 73.01 -1.24 0.11130 86.64 86.46 0.05 0.02731 87.91 88.46 -0.14 0.02632 86.42 91.45 -1.29 0.03133 103.87 97.43 1.68 0.06034 83.76 80.98 0.72 0.04535 84.35 89.95 -1.44 0.02836 68.64 75.00 -1.69 0.09037 100.50 93.44 1.82 0.03838 100.42 102.91 -0.67 0.111Mean 87.95 87.95 0.00 0.053The fitted values are the values predicted by the model for each observation; that is,a + b × x i. Instead of displaying the simple residuals, e i, these values have been dividedby their standard error: the resulting standardized residuals should be like observationsfrom a Normal distribution with unit variance, if the assumptions made in this analysisare valid. The leverage values indicate how influential each observation is: a large valueindicates that the fit of the model depends strongly on that observation.The statistics that are printed in the Summary of analysis are controlled by theSELECTION option of the FIT and RDISPLAY directives. The default for an ordinarylinear regression is to give the percentage variance accounted for and the standard errorof an individual observation (see output from the FIT statement earlier in this section).There are several alternative statistics, but these cannot be selected from the regressionmenus. However, you can give your own RDISPLAY command after fitting the regressionby the menu. For example,RDISPLAY [PRINT=summary; SELECTION=%ss]to print the percentage of the total sum of squares accounted for by the regression.Alternatively, you could copy the FIT statement from the Input log, and edit it in a newtext window to rerun the original analysis, but with a different summary.FIT [PRINT=model,summary,estimates; CONSTANT=estimate;\FPROB=yes; TPROB=yes; SELECTION=%ss] Age


