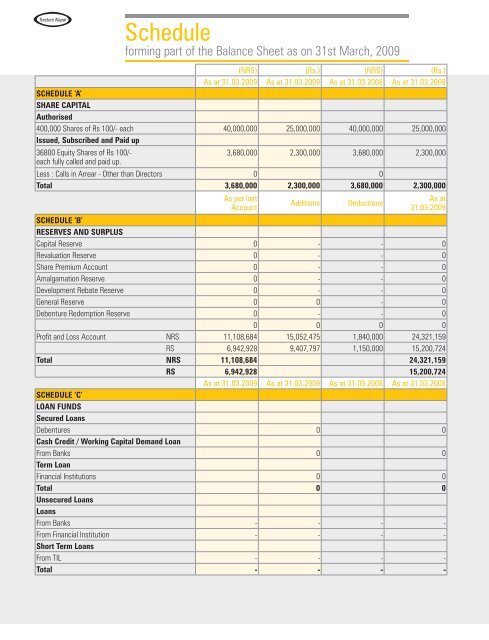
Tractors NepalScheduleforming part of <strong>the</strong> Balance Sheet as on 31st March, 2009(NRS) (Rs.) (NRS) (Rs.)As at 31.03.2009 As at 31.03.2009 As at 31.03.2008 As at 31.03.2008SCHEDULE ‘A’SHARE CAPITALAuthorised400,000 Shares of Rs 100/- each 40,000,000 25,000,000 40,000,000 25,000,000Issued, Subscribed and Paid up36800 Equity Shares of Rs 100/-3,680,000 2,300,000 3,680,000 2,300,000each fully called and paid up.Less : Calls in Arrear - O<strong>the</strong>r than Directors 0 0Total 3,680,000 2,300,000 3,680,000 2,300,000As per lastAccountAdditionsDeductionsAs at31.03.2009SCHEDULE ‘B’RESERVES AND SURPLUSCapital Reserve 0 - - 0Revaluation Reserve 0 - - 0Share Premium Account 0 - - 0Amalgamation Reserve 0 - - 0Development Rebate Reserve 0 - - 0General Reserve 0 0 - 0Debenture Redemption Reserve 0 - - 00 0 0 0Profit and Loss Account NRS 11,108,684 15,052,475 1,840,000 24,321,159RS 6,942,928 9,407,797 1,150,000 15,200,724Total NRS 11,108,684 24,321,159RS 6,942,928 15,200,724As at 31.03.2009 As at 31.03.2009 As at 31.03.2008 As at 31.03.2008SCHEDULE ‘C’LOAN FUNDSSecured LoansDebentures 0 0Cash Credit / Working Capital Demand LoanFrom Banks 0 0Term LoanFinancial Institutions 0 0Total 0 0Unsecured LoansLoansFrom Banks - - - -From Financial Institution - - - -Short Term LoansFrom TIL - - - -Total - - - -
Schedulesforming part of <strong>the</strong> Balance Sheet as on 31st March, 2009108109(NRS) (Rs.) (NRS) (Rs.)As at 31.03.2009 As at 31.03.2009As at31.03.2008As at31.03.2008SCHEDULE ‘D’CURRENT LIABILITIES AND PROVISIONSCurrent Liabilities :AcceptancesSundry Creditors 520,883 325,552 275,530 172,206Advance by Customers and o<strong>the</strong>rs 144,195 90,122 - -Holding Company - - - -Unclaimed/Unpaid Dividends - - - -O<strong>the</strong>r Liabilities 124,924 78,078 7,246 4,529Interest accrued but not due on Loans - - -790,002 493,751 282,776 176,735Provisions for :Taxation (Net of Advance payment of Tax) 4,564,657 2,852,911 3,247,340 2,029,588Proposed Dividend - - 1,840,000 1,150,000Tax on Dividend -Employees' benefit -- - -4,564,657 2,852,911 5,087,340 3,179,5885,354,659 3,346,662 5,370,116 3,356,323(Rs. in ‘000)Cost /Valuationas at31.03.2008Additions/Adjustmentduring <strong>the</strong>yearCost /Valuationof sales/Adjustmentetc during<strong>the</strong> yearTotal Cost /Valuationas at31.03.2009DepreciationProvidedup to31.03.2008DepreciationProvidedduring<strong>the</strong> yearDepreciationon Sales/Adjustmentetc during<strong>the</strong> yearDepreciationProvidedup to31.03.2009Net Valueof Assetsas at31.03.2009Net Valueof Assetsas at31.03.2008SCHEDULE ‘E’FIXED ASSETSFreehold Land - - - - - - - - - -Leasehold Land (a) - - - - - - - - - -Buildings :Leasehold 166,009 - - 166,009 118,973 33,202 - 152,175 13,834 47,036Freehold - - - - - - - - - -Plant and109,824 25,693 - 135,517 31,903 6,209 - 38,113 97,404 77,921MachineryTubewell - - - - - - - - - -Furnitures 293,486 11,563 - 305,048 88,080 17,014 - 105,094 199,954 205,406Office Equipments 166,758 98,496 - 265,254 103,364 32,833 - 136,197 129,057 63,394Cycle and Motor- 120,000 - 120,000 - 18,000 - 18,000 102,000 -VehiclesTotal 736,077 255,751 - 991828 342,320 107,259 - 449,579 542,249 393,757Previous year 73,053 46,913 - 736,077 263,061 79,259 - 342,320 393,757 -Financial Statements (TNPL)