view / download the documents. - til india
view / download the documents. - til india
view / download the documents. - til india
- No tags were found...

You also want an ePaper? Increase the reach of your titles
YUMPU automatically turns print PDFs into web optimized ePapers that Google loves.
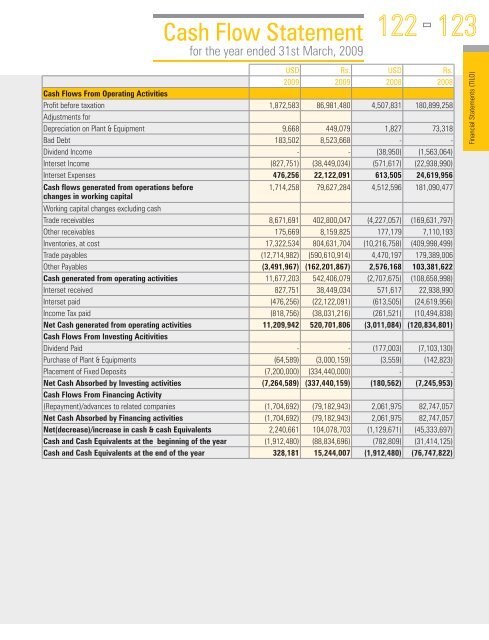
Cash Flow Statementfor <strong>the</strong> year ended 31st March, 2009122123USD Rs. USD Rs.2009 2009 2008 2008Cash Flows From Operating ActivitiesProfit before taxation 1,872,583 86,981,480 4,507,831 180,899,258Adjustments forDepreciation on Plant & Equipment 9,668 449,079 1,827 73,318Bad Debt 183,502 8,523,668 - -Dividend Income - - (38,950) (1,563,064)Interset Income (827,751) (38,449,034) (571,617) (22,938,990)Interset Expenses 476,256 22,122,091 613,505 24,619,956Cash flows generated from operations before1,714,258 79,627,284 4,512,596 181,090,477changes in working capitalWorking capital changes excluding cashTrade receivables 8,671,691 402,800,047 (4,227,057) (169,631,797)O<strong>the</strong>r receivables 175,669 8,159,825 177,179 7,110,193Inventories, at cost 17,322,534 804,631,704 (10,216,758) (409,998,499)Trade payables (12,714,982) (590,610,914) 4,470,197 179,389,006O<strong>the</strong>r Payables (3,491,967) (162,201,867) 2,576,168 103,381,622Cash generated from operating activities 11,677,203 542,406,079 (2,707,675) (108,658,998)Interset received 827,751 38,449,034 571,617 22,938,990Interset paid (476,256) (22,122,091) (613,505) (24,619,956)Income Tax paid (818,756) (38,031,216) (261,521) (10,494,838)Net Cash generated from operating activities 11,209,942 520,701,806 (3,011,084) (120,834,801)Cash Flows From Investing AcitivitiesDividend Paid - - (177,003) (7,103,130)Purchase of Plant & Equipments (64,589) (3,000,159) (3,559) (142,823)Placement of Fixed Deposits (7,200,000) (334,440,000) - -Net Cash Absorbed by Investing activities (7,264,589) (337,440,159) (180,562) (7,245,953)Cash Flows From Financing Activity(Repayment)/advances to related companies (1,704,692) (79,182,943) 2,061,975 82,747,057Net Cash Absorbed by Financing activities (1,704,692) (79,182,943) 2,061,975 82,747,057Net(decrease)/increase in cash & cash Equivalents 2,240,661 104,078,703 (1,129,671) (45,333,697)Cash and Cash Equivalents at <strong>the</strong> beginning of <strong>the</strong> year (1,912,480) (88,834,696) (782,809) (31,414,125)Cash and Cash Equivalents at <strong>the</strong> end of <strong>the</strong> year 328,181 15,244,007 (1,912,480) (76,747,822)Financial Statements (TILO)