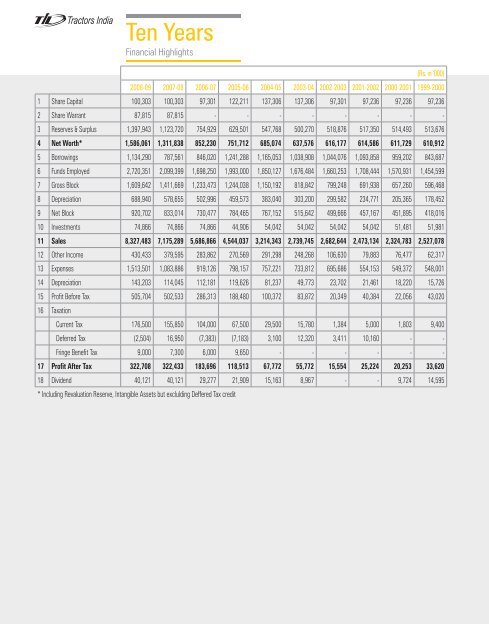
Ten YearsFinancial Highlights(Rs. in ‘000)2008-09 2007-08 2006-07 2005-06 2004-05 2003-04 2002-2003 2001-2002 2000-2001 1999-20001 Share Capital 100,303 100,303 97,301 122,211 137,306 137,306 97,301 97,236 97,236 97,2362 Share Warrant 87,815 87,815 - - - - - - - -3 Reserves & Surplus 1,397,943 1,123,720 754,929 629,501 547,768 500,270 518,876 517,350 514,493 513,6764 Net Worth* 1,586,061 1,311,838 852,230 751,712 685,074 637,576 616,177 614,586 611,729 610,9125 Borrowings 1,134,290 787,561 846,020 1,241,288 1,165,053 1,038,908 1,044,076 1,093,858 959,202 843,6876 Funds Employed 2,720,351 2,099,399 1,698,250 1,993,000 1,850,127 1,676,484 1,660,253 1,708,444 1,570,931 1,454,5997 Gross Block 1,609,642 1,411,669 1,233,473 1,244,038 1,150,192 818,842 799,248 691,938 657,260 596,4688 Depreciation 688,940 578,655 502,996 459,573 383,040 303,200 299,582 234,771 205,365 178,4529 Net Block 920,702 833,014 730,477 784,465 767,152 515,642 499,666 457,167 451,895 418,01610 Investments 74,866 74,866 74,866 44,906 54,042 54,042 54,042 54,042 51,481 51,98111 Sales 8,327,483 7,175,289 5,686,866 4,544,037 3,214,343 2,739,745 2,682,644 2,473,134 2,324,783 2,527,07812 O<strong>the</strong>r Income 430,433 379,595 283,862 270,569 291,298 248,268 106,630 79,883 76,477 62,31713 Expenses 1,513,501 1,083,886 919,126 798,157 757,221 733,812 695,686 554,153 549,372 548,00114 Depreciation 143,203 114,045 112,181 119,626 81,237 49,773 23,702 21,461 18,220 15,72615 Profit Before Tax 505,704 502,533 286,313 188,480 100,372 83,872 20,349 40,384 22,056 43,02016 TaxationCurrent Tax 176,500 155,850 104,000 67,500 29,500 15,780 1,384 5,000 1,803 9,400Deferred Tax (2,504) 16,950 (7,383) (7,183) 3,100 12,320 3,411 10,160 - -Fringe Benefit Tax 9,000 7,300 6,000 9,650 - - - - - -17 Profit After Tax 322,708 322,433 183,696 118,513 67,772 55,772 15,554 25,224 20,253 33,62018 Dividend 40,121 40,121 29,277 21,909 15,163 8,967 - - 9,724 14,595* Including Revaluation Reserve, Intangible Assets but exclulding Deffered Tax credit
Auditors’ Reportto <strong>the</strong> Members of TIL LIMITED0500511. We have audited <strong>the</strong> attached Balance Sheet of TIL Limitedas at 31st March, 2009, <strong>the</strong> related Profit and Loss Accountand <strong>the</strong> Cash Flow Statement for <strong>the</strong> year ended on that dateannexed <strong>the</strong>reto, all of which we have signed under referenceto this report. These financial statements are <strong>the</strong> responsibilityof <strong>the</strong> Company’s management. Our responsibility is to expressan opinion on <strong>the</strong>se financial statements based on our audit.2. We conducted our audit in accordance with auditing standardsgenerally accepted in India. Those Standards require that weplan and perform <strong>the</strong> audit to obtain reasonable assuranceabout whe<strong>the</strong>r <strong>the</strong> financial statements are free of materialmisstatement. An audit includes, examining on a test basis,evidence supporting <strong>the</strong> amounts and disclosures in <strong>the</strong>financial statements. An audit also includes assessing <strong>the</strong>accounting principles used and significant estimates madeby management, as well as evaluating <strong>the</strong> overall financialstatement presentation. We believe that our audit providesreasonable basis for our opinion.3. As required by <strong>the</strong> Companies (Auditor’s Report) Order, 2003,as amended by <strong>the</strong> Companies (Auditor’s Report) (Amendment)Order, 2004, issued by <strong>the</strong> Central Government of India in termsof sub-section (4A) of Section 227 of ‘The Companies Act, 1956’of India (<strong>the</strong> ‘Act’) and on <strong>the</strong> basis of such checks of <strong>the</strong> booksand records of <strong>the</strong> Company as we considered appropriate andaccording to <strong>the</strong> information and explanations given to us, wegive in <strong>the</strong> Annexure a statement on <strong>the</strong> matters specified inparagraphs 4 and 5 of <strong>the</strong> said Order.4. Fur<strong>the</strong>r to our comments in paragraph 3 above, we report that:a) We have obtained all <strong>the</strong> information and explanations,which to <strong>the</strong> best of our knowledge and belief werenecessary for <strong>the</strong> purposes of our audit;b) In our opinion, proper books of account as required by lawhave been kept by <strong>the</strong> Company so far as appears from ourexamination of those books;c) The Balance Sheet, <strong>the</strong> Profit and Loss Account and <strong>the</strong>Cash Flow Statement dealt with by this report are inagreement with <strong>the</strong> books of account;d) In our opinion, <strong>the</strong> Balance Sheet, <strong>the</strong> Profit and LossAccount and <strong>the</strong> Cash Flow Statement dealt with by thisreport comply with <strong>the</strong> applicable accounting standardsreferred to in sub-section (3C) of Section 211 of <strong>the</strong> Act;e) On <strong>the</strong> basis of written representations received from <strong>the</strong>directors, as on 31st March, 2009, and taken on record by<strong>the</strong> Board of Directors, none of <strong>the</strong> directors is disqualifiedas on 31st March, 2009 from being appointed as a directorin terms of clause (g) of sub – section (1) of Section 274 of<strong>the</strong> Act;f) In our opinion and to <strong>the</strong> best of our information andaccording to <strong>the</strong> explanations given to us, <strong>the</strong> saidfinancial statements toge<strong>the</strong>r with <strong>the</strong> notes <strong>the</strong>reonand attached <strong>the</strong>reto give in <strong>the</strong> prescribed manner <strong>the</strong>information required by <strong>the</strong> Act and give a true and fair<strong>view</strong> in conformity with <strong>the</strong> accounting principles generallyaccepted in India :i) in <strong>the</strong> case of <strong>the</strong> Balance Sheet, of <strong>the</strong> state of affairsof <strong>the</strong> Company as at 31st March, 2009;ii) in <strong>the</strong> case of <strong>the</strong> Profit and Loss Account, of <strong>the</strong> profitfor <strong>the</strong> year ended on that date; andiii) in <strong>the</strong> case of Cash Flow Statement, of <strong>the</strong> cash flowsfor <strong>the</strong> year ended on that date.Place : KolkataDate : 11th May, 2009.S.K.DebPartnerMembership Number – 13390For and on behalf ofPrice WaterhouseChartered AccountantsFinancial Statements (TIL)