view / download the documents. - til india
view / download the documents. - til india
view / download the documents. - til india
- No tags were found...

You also want an ePaper? Increase the reach of your titles
YUMPU automatically turns print PDFs into web optimized ePapers that Google loves.
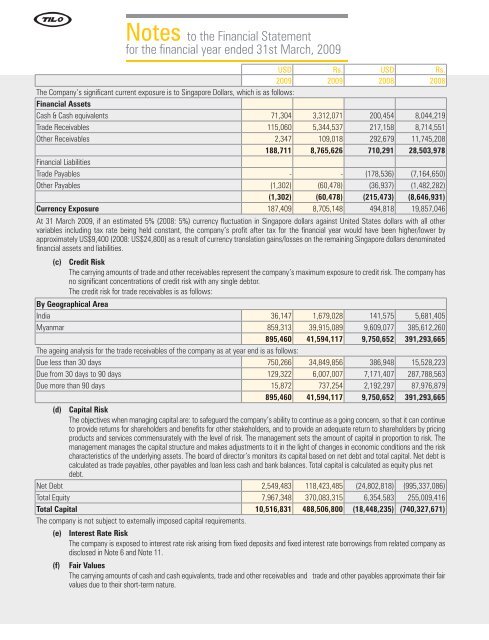
Notes to <strong>the</strong> Financial Statementfor <strong>the</strong> financial year ended 31st March, 2009USD Rs. USD Rs.2009 2009 2008 2008The Company’s significant current exposure is to Singapore Dollars, which is as follows:Financial AssetsCash & Cash equivalents 71,304 3,312,071 200,454 8,044,219Trade Receivables 115,060 5,344,537 217,158 8,714,551O<strong>the</strong>r Receivables 2,347 109,018 292,679 11,745,208188,711 8,765,626 710,291 28,503,978Financial LiabilitiesTrade Payables - - (178,536) (7,164,650)O<strong>the</strong>r Payables (1,302) (60,478) (36,937) (1,482,282)(1,302) (60,478) (215,473) (8,646,931)Currency Exposure 187,409 8,705,148 494,818 19,857,046At 31 March 2009, if an estimated 5% (2008: 5%) currency fluctuation in Singapore dollars against United States dollars with all o<strong>the</strong>rvariables including tax rate being held constant, <strong>the</strong> company’s profit after tax for <strong>the</strong> financial year would have been higher/lower byapproximately US$9,400 (2008: US$24,800) as a result of currency translation gains/losses on <strong>the</strong> remaining Singapore dollars denominatedfinancial assets and liabilities.(c) Credit RiskThe carrying amounts of trade and o<strong>the</strong>r receivables represent <strong>the</strong> company’s maximum exposure to credit risk. The company hasno significant concentrations of credit risk with any single debtor.The credit risk for trade receivables is as follows:By Geographical AreaIndia 36,147 1,679,028 141,575 5,681,405Myanmar 859,313 39,915,089 9,609,077 385,612,260895,460 41,594,117 9,750,652 391,293,665The ageing analysis for <strong>the</strong> trade receivables of <strong>the</strong> company as at year end is as follows:Due less than 30 days 750,266 34,849,856 386,948 15,528,223Due from 30 days to 90 days 129,322 6,007,007 7,171,407 287,788,563Due more than 90 days 15,872 737,254 2,192,297 87,976,879895,460 41,594,117 9,750,652 391,293,665(d) Capital RiskThe objectives when managing capital are: to safeguard <strong>the</strong> company’s ability to continue as a going concern, so that it can continueto provide returns for shareholders and benefits for o<strong>the</strong>r stakeholders, and to provide an adequate return to shareholders by pricingproducts and services commensurately with <strong>the</strong> level of risk. The management sets <strong>the</strong> amount of capital in proportion to risk. Themanagement manages <strong>the</strong> capital structure and makes adjustments to it in <strong>the</strong> light of changes in economic conditions and <strong>the</strong> riskcharacteristics of <strong>the</strong> underlying assets. The board of director’s monitors its capital based on net debt and total capital. Net debt iscalculated as trade payables, o<strong>the</strong>r payables and loan less cash and bank balances. Total capital is calculated as equity plus netdebt.Net Debt 2,549,483 118,423,485 (24,802,818) (995,337,086)Total Equity 7,967,348 370,083,315 6,354,583 255,009,416Total Capital 10,516,831 488,506,800 (18,448,235) (740,327,671)The company is not subject to externally imposed capital requirements.(e) Interest Rate RiskThe company is exposed to interest rate risk arising from fixed deposits and fixed interest rate borrowings from related company asdisclosed in Note 6 and Note 11.(f) Fair ValuesThe carrying amounts of cash and cash equivalents, trade and o<strong>the</strong>r receivables and trade and o<strong>the</strong>r payables approximate <strong>the</strong>ir fairvalues due to <strong>the</strong>ir short-term nature.