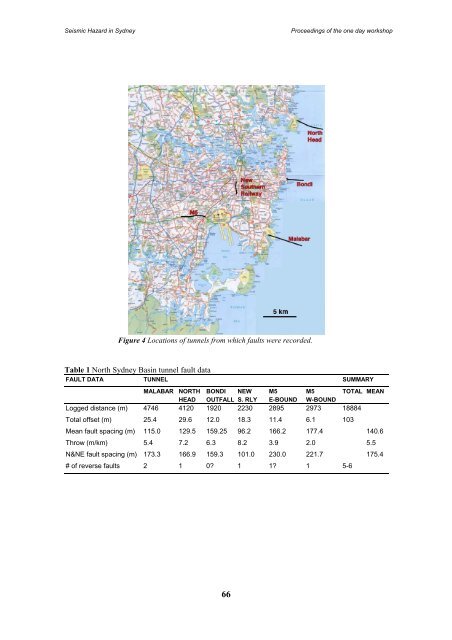
Seismic Hazard <strong>in</strong> <strong>Sydney</strong>Proceed<strong>in</strong>gs of <strong>the</strong> one day workshopThe pattern of fault<strong>in</strong>g for a 10 km 25 km portion of <strong>the</strong> Sou<strong>the</strong>rn Coalfield is shown <strong>in</strong> Figure 3.This region is part of <strong>the</strong> coastal zone which is bounded to <strong>the</strong> west by <strong>the</strong> South Coast Monocl<strong>in</strong>e.Faults <strong>in</strong> this region comprise two ma<strong>in</strong> sets that strike approximately northwest and north to northnor<strong>the</strong>ast.The northwest strik<strong>in</strong>g faults are regional structures with typical trace lengths of 5 to >10km, maximum apparent throws of 25 to 90 m (Lohe et al., 1992), and predom<strong>in</strong>antly strike-slipmotion. The spac<strong>in</strong>gs of regional faults <strong>in</strong> this set are often 1–3 km. The more nor<strong>the</strong>rly strik<strong>in</strong>gfault set has predom<strong>in</strong>antly dip-slip offsets and is dom<strong>in</strong>ated by two clustered fault arrays, which arespaced at 3–4 km (Figure 3.) and have a maximum length of 10 km. In <strong>the</strong> Wollongong–PortHack<strong>in</strong>g area <strong>the</strong>re is a tendency for faults strik<strong>in</strong>g north-nor<strong>the</strong>ast to have displacements of lessthan 15 m, whereas faults strik<strong>in</strong>g west-northwest and northwest can reach 100 m <strong>in</strong> displacement(Sherw<strong>in</strong> & Holmes, 1986). The northwest strik<strong>in</strong>g faults appear to have accommodated <strong>the</strong> highestdisplacements and can be regarded as <strong>the</strong> dom<strong>in</strong>ant structures <strong>in</strong> <strong>the</strong> Sou<strong>the</strong>rn Coalfield.Although net displacements on <strong>the</strong> north-nor<strong>the</strong>ast strik<strong>in</strong>g fault sets are normal, small-scale fielddata <strong>in</strong>dicates that many of <strong>the</strong>se faults experienced late-stage reverse reactivation (Shepherd, pers.comm., 2002). A component of reverse displacement on north to north-nor<strong>the</strong>ast strik<strong>in</strong>g faults ands<strong>in</strong>istral strike-slip on northwest strik<strong>in</strong>g faults is consistent with contemporary stra<strong>in</strong> data which aredom<strong>in</strong>ated by a nor<strong>the</strong>ast to east pr<strong>in</strong>cipal horizontal shorten<strong>in</strong>g direction (Hillis et al., 1999). Thusboth fault sets could be active <strong>in</strong> <strong>the</strong> contemporary stra<strong>in</strong> field. Therefore, <strong>in</strong> our calculations ofmoment release rate we use both fault sets. Given that <strong>the</strong> northwest fault set is greater <strong>in</strong> number, <strong>in</strong>maximum apparent throw, and <strong>in</strong> trace length, we have assigned a greater component of <strong>the</strong> momentrelease to this set than to <strong>the</strong> more nor<strong>the</strong>rly-strik<strong>in</strong>g faults.Nor<strong>the</strong>rn tunnel log dataSome of <strong>the</strong> most complete fault data <strong>in</strong> <strong>the</strong> <strong>Sydney</strong> region, with respect to spac<strong>in</strong>g, sense of slip,and displacement, are from tunnels, which, on <strong>the</strong> scale of <strong>the</strong> bas<strong>in</strong>, produce one-dimensionalsamples of <strong>the</strong> fault population. Here we use data from six tunnels located <strong>in</strong> central and north<strong>Sydney</strong> trend<strong>in</strong>g <strong>in</strong> east-west (five tunnels <strong>in</strong>clud<strong>in</strong>g two from <strong>the</strong> M5 motorway) and north-south(one tunnel) directions (Figure 4). For each tunnel, fault locations, orientations, and netdisplacements were recorded. The fault data for <strong>the</strong>se tunnels are summarised <strong>in</strong> Table 1. Thesedata permit <strong>the</strong> spac<strong>in</strong>g between adjacent faults to be estimated and <strong>the</strong>se values were used forpartition<strong>in</strong>g moment release among <strong>the</strong> dip-slip structures.In each tunnel, faults were recorded where <strong>the</strong>y offset beds with<strong>in</strong> <strong>the</strong> Hawkesbury SandstoneFormation. A total of 133 faults were recorded <strong>in</strong> all tunnels with <strong>the</strong> ma<strong>in</strong> fault strikes be<strong>in</strong>gapproximately north to nor<strong>the</strong>ast and northwest (Figure 5a). Approximately 128 faults have netnormal displacement, while <strong>the</strong> rema<strong>in</strong>der have net reverse displacement. Displacements range up to9 m with most faults (110) carry<strong>in</strong>g ≤ 1 m (Figure 5b).Fault spac<strong>in</strong>g was calculated for both reverse and normal faults and for northwest and northnor<strong>the</strong>aststrik<strong>in</strong>g fault sets. We calculate an average normal fault spac<strong>in</strong>g of 140 m. This value<strong>in</strong>creases to 175 m if we consider only faults with a north to nor<strong>the</strong>ast strike. These results appear tobe <strong>in</strong>dependent of tunnel trend.Determ<strong>in</strong><strong>in</strong>g <strong>the</strong> spac<strong>in</strong>g of faults that have experienced reverse reactivation is more difficult. This isbecause net displacements provide no <strong>in</strong>dication of reverse movement on a reactivated fault if <strong>the</strong>magnitude of <strong>the</strong> reverse movement was less than earlier normal slip on <strong>the</strong> fault. Therefore, <strong>the</strong>maximum spac<strong>in</strong>g for reverse faults is approximately 3.5 km, while <strong>the</strong> m<strong>in</strong>imum could be as littleas 180 m, <strong>the</strong> spac<strong>in</strong>g of faults with net normal displacement. This lack of knowledge is handled asalternative branches with assigned weights <strong>in</strong> <strong>the</strong> probabilistic analysis.65
Seismic Hazard <strong>in</strong> <strong>Sydney</strong>Proceed<strong>in</strong>gs of <strong>the</strong> one day workshopFigure 4 Locations of tunnels from which faults were recorded.Table 1 North <strong>Sydney</strong> Bas<strong>in</strong> tunnel fault dataFAULT DATA TUNNEL SUMMARYMALABAR NORTH BONDI NEW M5 M5 TOTAL MEANHEAD OUTFALL S. RLY E-BOUND W-BOUNDLogged distance (m) 4746 4120 1920 2230 2895 2973 18884Total offset (m) 25.4 29.6 12.0 18.3 11.4 6.1 103Mean fault spac<strong>in</strong>g (m) 115.0 129.5 159.25 96.2 166.2 177.4 140.6Throw (m/km) 5.4 7.2 6.3 8.2 3.9 2.0 5.5N&NE fault spac<strong>in</strong>g (m) 173.3 166.9 159.3 101.0 230.0 221.7 175.4# of reverse faults 2 1 0? 1 1? 1 5-666