Integrating Immigrant Children into Schools in Europe
Integrating Immigrant Children into Schools in Europe
Integrating Immigrant Children into Schools in Europe

Create successful ePaper yourself
Turn your PDF publications into a flip-book with our unique Google optimized e-Paper software.
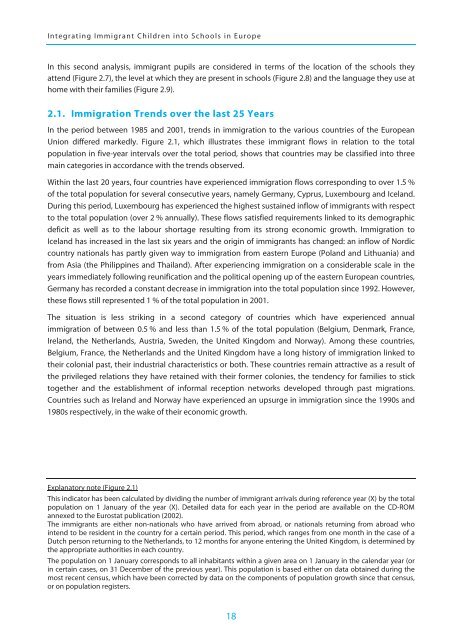
<strong>Integrat<strong>in</strong>g</strong> <strong>Immigrant</strong> <strong>Children</strong> <strong><strong>in</strong>to</strong> <strong>Schools</strong> <strong>in</strong> <strong>Europe</strong>In this second analysis, immigrant pupils are considered <strong>in</strong> terms of the location of the schools theyattend (Figure 2.7), the level at which they are present <strong>in</strong> schools (Figure 2.8) and the language they use athome with their families (Figure 2.9).2.1. Immigration Trends over the last 25 YearsIn the period between 1985 and 2001, trends <strong>in</strong> immigration to the various countries of the <strong>Europe</strong>anUnion differed markedly. Figure 2.1, which illustrates these immigrant flows <strong>in</strong> relation to the totalpopulation <strong>in</strong> five-year <strong>in</strong>tervals over the total period, shows that countries may be classified <strong><strong>in</strong>to</strong> threema<strong>in</strong> categories <strong>in</strong> accordance with the trends observed.With<strong>in</strong> the last 20 years, four countries have experienced immigration flows correspond<strong>in</strong>g to over 1.5 %of the total population for several consecutive years, namely Germany, Cyprus, Luxembourg and Iceland.Dur<strong>in</strong>g this period, Luxembourg has experienced the highest susta<strong>in</strong>ed <strong>in</strong>flow of immigrants with respectto the total population (over 2 % annually). These flows satisfied requirements l<strong>in</strong>ked to its demographicdeficit as well as to the labour shortage result<strong>in</strong>g from its strong economic growth. Immigration toIceland has <strong>in</strong>creased <strong>in</strong> the last six years and the orig<strong>in</strong> of immigrants has changed: an <strong>in</strong>flow of Nordiccountry nationals has partly given way to immigration from eastern <strong>Europe</strong> (Poland and Lithuania) andfrom Asia (the Philipp<strong>in</strong>es and Thailand). After experienc<strong>in</strong>g immigration on a considerable scale <strong>in</strong> theyears immediately follow<strong>in</strong>g reunification and the political open<strong>in</strong>g up of the eastern <strong>Europe</strong>an countries,Germany has recorded a constant decrease <strong>in</strong> immigration <strong><strong>in</strong>to</strong> the total population s<strong>in</strong>ce 1992. However,these flows still represented 1 % of the total population <strong>in</strong> 2001.The situation is less strik<strong>in</strong>g <strong>in</strong> a second category of countries which have experienced annualimmigration of between 0.5 % and less than 1.5 % of the total population (Belgium, Denmark, France,Ireland, the Netherlands, Austria, Sweden, the United K<strong>in</strong>gdom and Norway). Among these countries,Belgium, France, the Netherlands and the United K<strong>in</strong>gdom have a long history of immigration l<strong>in</strong>ked totheir colonial past, their <strong>in</strong>dustrial characteristics or both. These countries rema<strong>in</strong> attractive as a result ofthe privileged relations they have reta<strong>in</strong>ed with their former colonies, the tendency for families to sticktogether and the establishment of <strong>in</strong>formal reception networks developed through past migrations.Countries such as Ireland and Norway have experienced an upsurge <strong>in</strong> immigration s<strong>in</strong>ce the 1990s and1980s respectively, <strong>in</strong> the wake of their economic growth.Explanatory note (Figure 2.1)This <strong>in</strong>dicator has been calculated by divid<strong>in</strong>g the number of immigrant arrivals dur<strong>in</strong>g reference year (X) by the totalpopulation on 1 January of the year (X). Detailed data for each year <strong>in</strong> the period are available on the CD-ROMannexed to the Eurostat publication (2002).The immigrants are either non-nationals who have arrived from abroad, or nationals return<strong>in</strong>g from abroad who<strong>in</strong>tend to be resident <strong>in</strong> the country for a certa<strong>in</strong> period. This period, which ranges from one month <strong>in</strong> the case of aDutch person return<strong>in</strong>g to the Netherlands, to 12 months for anyone enter<strong>in</strong>g the United K<strong>in</strong>gdom, is determ<strong>in</strong>ed bythe appropriate authorities <strong>in</strong> each country.The population on 1 January corresponds to all <strong>in</strong>habitants with<strong>in</strong> a given area on 1 January <strong>in</strong> the calendar year (or<strong>in</strong> certa<strong>in</strong> cases, on 31 December of the previous year). This population is based either on data obta<strong>in</strong>ed dur<strong>in</strong>g themost recent census, which have been corrected by data on the components of population growth s<strong>in</strong>ce that census,or on population registers.18