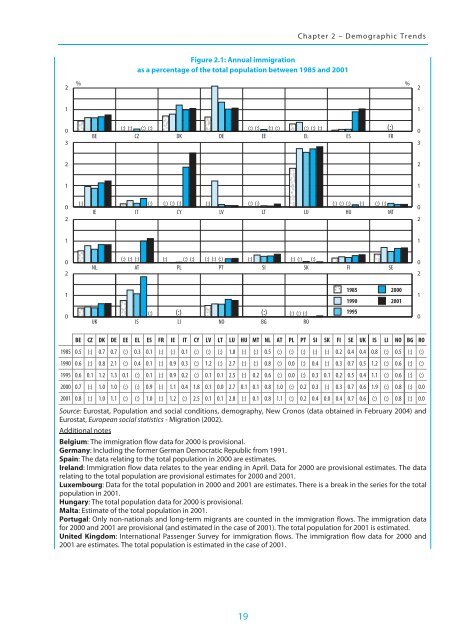
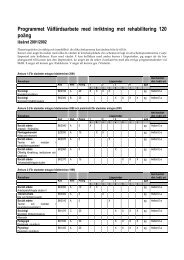
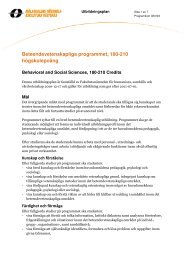
Chapter 2 – Demographic TrendsFigure 2.1: Annual immigrationas a percentage of the total population between 1985 and 20012% %21103BE(:) (:) (:) (:) (:) (:) (:) (:) (:) (:) (:) (:)CZDKDEEEELESFR03221102(:) (:) (:) (:) (:) (:) (:) (:) (:) (:) (:) (:) (:) (:)IEITCYLVLTLUHUMT021102NL(:) (:) (:) (:) (:) (:) (:) (:) (:)ATPLPT(:)SI(:) (:) (:)SKFISE021198519902000200110UKIS(:)(:) (:) (:) (:) (:)LINOBGRO19950BE CZ DK DE EE EL ES FR IE IT CY LV LT LU HU MT NL AT PL PT SI SK FI SE UK IS LI NO BG RO1985 0.5 (:) 0.7 0.7 (:) 0.3 0.1 (:) (:) 0.1 (:) (:) (:) 1.8 (:) (:) 0.5 (:) (:) (:) (:) (:) 0.2 0.4 0.4 0.8 (:) 0.5 (:) (:)1990 0.6 (:) 0.8 2.1 (:) 0.4 0.1 (:) 0.9 0.3 (:) 1.2 (:) 2.7 (:) (:) 0.8 (:) 0.0 (:) 0.4 (:) 0.3 0.7 0.5 1.2 (:) 0.6 (:) (:)1995 0.6 0.1 1.2 1.3 0.1 (:) 0.1 (:) 0.9 0.2 (:) 0.1 0.1 2.5 (:) 0.2 0.6 (:) 0.0 (:) 0.3 0.1 0.2 0.5 0.4 1.1 (:) 0.6 (:) (:)2000 0.7 (:) 1.0 1.0 (:) (:) 0.9 (:) 1.1 0.4 1.8 0.1 0.0 2.7 0.1 0.1 0.8 1.0 (:) 0.2 0.3 (:) 0.3 0.7 0.6 1.9 (:) 0.8 (:) 0.02001 0.8 (:) 1.0 1.1 (:) (:) 1.0 (:) 1.2 (:) 2.5 0.1 0.1 2.8 (:) 0.1 0.8 1.1 (:) 0.2 0.4 0.0 0.4 0.7 0.6 (:) (:) 0.8 (:) 0.0Source: Eurostat, Population and social conditions, demography, New Cronos (data obta<strong>in</strong>ed <strong>in</strong> February 2004) andEurostat, <strong>Europe</strong>an social statistics - Migration (2002).Additional notesBelgium: The immigration flow data for 2000 is provisional.Germany: Includ<strong>in</strong>g the former German Democratic Republic from 1991.Spa<strong>in</strong>: The data relat<strong>in</strong>g to the total population <strong>in</strong> 2000 are estimates.Ireland: Immigration flow data relates to the year end<strong>in</strong>g <strong>in</strong> April. Data for 2000 are provisional estimates. The datarelat<strong>in</strong>g to the total population are provisional estimates for 2000 and 2001.Luxembourg: Data for the total population <strong>in</strong> 2000 and 2001 are estimates. There is a break <strong>in</strong> the series for the totalpopulation <strong>in</strong> 2001.Hungary: The total population data for 2000 is provisional.Malta: Estimate of the total population <strong>in</strong> 2001.Portugal: Only non-nationals and long-term migrants are counted <strong>in</strong> the immigration flows. The immigration datafor 2000 and 2001 are provisional (and estimated <strong>in</strong> the case of 2001). The total population for 2001 is estimated.United K<strong>in</strong>gdom: International Passenger Survey for immigration flows. The immigration flow data for 2000 and2001 are estimates. The total population is estimated <strong>in</strong> the case of 2001.19
<strong>Integrat<strong>in</strong>g</strong> <strong>Immigrant</strong> <strong>Children</strong> <strong><strong>in</strong>to</strong> <strong>Schools</strong> <strong>in</strong> <strong>Europe</strong>Annual immigration of less than 0.5 % of the total population has ma<strong>in</strong>ly been recorded <strong>in</strong> the new EUmember countries (except Cyprus) as well as <strong>in</strong> Greece, Italy and F<strong>in</strong>land. This situation also applied toSpa<strong>in</strong> and Portugal until the end of the 1990s. Both these countries underwent a major transitional phasedur<strong>in</strong>g the period concerned. From be<strong>in</strong>g countries associated with emigration, they became hostcountries. This change <strong>in</strong> migratory flows is attributable to several factors, the most important of whichseems to be strong economic growth and the structural changes <strong>in</strong>duced by these countries jo<strong>in</strong><strong>in</strong>g the<strong>Europe</strong>an Community <strong>in</strong> 1986. Greece also experienced renewed immigration when the countries ofeastern <strong>Europe</strong> opened up between 1990 and1995 and citizens of Greek orig<strong>in</strong> returned to the countryon a substantial scale.In eastern <strong>Europe</strong>, immigration has been attributable to two ma<strong>in</strong> factors, namely population movementsrelated to political renewal <strong>in</strong> the countries concerned and their transition to a market economy. Theyhave accord<strong>in</strong>gly experienced a renewed modest <strong>in</strong>crease <strong>in</strong> immigration follow<strong>in</strong>g their transition todemocracy (Czech Republic, Hungary, Poland, the Slovak Republic, Bulgaria and Romania) or theirdeclaration of <strong>in</strong>dependence (Estonia, Latvia and Lithuania). This transition has often gone hand <strong>in</strong> handwith the return of a proportion of those belong<strong>in</strong>g to ethnic m<strong>in</strong>orities who were scattered throughoutvarious countries <strong>in</strong> the (former) eastern bloc, or who had settled <strong>in</strong> western <strong>Europe</strong> immediately after theSecond World War. These countries have also had to confront an <strong>in</strong>flux of refugees as a result of theconflicts that deeply affected central <strong>Europe</strong> and the Balkans <strong>in</strong> the f<strong>in</strong>al years of the 20th century(refugees from the former Yugoslavia <strong>in</strong> Slovenia or from the Republic of Moldova <strong>in</strong> Romania). Yetimmigration to them has rema<strong>in</strong>ed modest <strong>in</strong> relation to their total population.F<strong>in</strong>ally, very limited immigration to Malta (under 0.2 % a year <strong>in</strong> the period between 1985-2001) maypartly be attributed to the small size of the island.2.2. Countries and Cont<strong>in</strong>ents of Orig<strong>in</strong> of the Foreign PopulationThe data <strong>in</strong> the table under Figure 2.2A show that, on 1 January 2002 <strong>in</strong> the majority of countries, theforeign population was recorded as between 2.5 % and 9 % of the total population. This applied toBelgium, Denmark, Germany, Greece, Spa<strong>in</strong>, France, Ireland, Italy, Cyprus, the Netherlands, Austria,Sweden, the United K<strong>in</strong>gdom, Iceland and Norway. The situation <strong>in</strong> the other countries was markedlydifferent. The proportion of the foreign population recorded <strong>in</strong> the total population was 20 % <strong>in</strong> Estoniaand Latvia – as a result of the size of their m<strong>in</strong>ority population of Russian orig<strong>in</strong> (many of whom were notEstonian or Latvian nationals) – Luxembourg and Liechtenste<strong>in</strong>, whereas <strong>in</strong> Hungary, Lithuania, Portugal,Slovenia and F<strong>in</strong>land, the foreign population accounted for under 2.5 % of the total population.Over and above the relative size of these foreign populations <strong>in</strong> the various countries, it is important herethat their own countries and cont<strong>in</strong>ents of orig<strong>in</strong> should be more clearly identified. Two majorapproaches have been adopted to exam<strong>in</strong>e, on the one hand, the proportion of non-nationals who arenationals of EU-15 countries as opposed to any other country of orig<strong>in</strong> (Figure 2.2A) and, on the other, theproportion of the foreign population <strong>in</strong> the population, by cont<strong>in</strong>ent of orig<strong>in</strong> (Figure 2.2B). As the freecirculation of persons has not yet been established on a fully uniform basis for the 25-member <strong>Europe</strong>anUnion, both these <strong>in</strong>dicators still relate to the 15-country EU.From both these diagrams, it may be concluded overall that the orig<strong>in</strong> of the foreign population variesamong the countries for which data are available. More specifically, as illustrated <strong>in</strong> Figure 2.2A, theproportion of all nationals of third countries <strong>in</strong> the total population (i.e. countries other than those <strong>in</strong> the15-member EU) is higher than the proportion of citizens of countries <strong>in</strong> the 15-member EU, <strong>in</strong> all countriesexcept Belgium, Ireland and Luxembourg. However, the breakdown of the immigrant population by their20