Integrating Immigrant Children into Schools in Europe
Integrating Immigrant Children into Schools in Europe
Integrating Immigrant Children into Schools in Europe

Create successful ePaper yourself
Turn your PDF publications into a flip-book with our unique Google optimized e-Paper software.
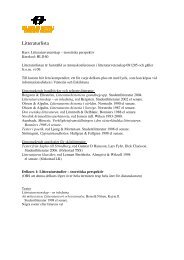
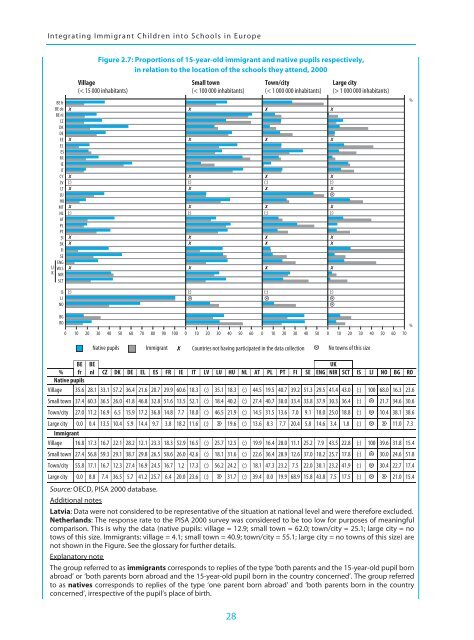
<strong>Integrat<strong>in</strong>g</strong> <strong>Immigrant</strong> <strong>Children</strong> <strong><strong>in</strong>to</strong> <strong>Schools</strong> <strong>in</strong> <strong>Europe</strong>BE frBE deBE nlCZDKDEEEELESFRIEITCYLVLTLUHUMTNLATPLPTSISKUKFISEENGWLSNIRSCTFigure 2.7: Proportions of 15-year-old immigrant and native pupils respectively,<strong>in</strong> relation to the location of the schools they attend, 2000Village(< 15 000 <strong>in</strong>habitants)Small town(< 100 000 <strong>in</strong>habitants)Town/city(< 1 000 000 <strong>in</strong>habitants)✗ ✗ ✗ ✗✗ ✗ ✗ ✗✗ ✗ ✗ ✗(:) (:) (:) (:)✗ ✗ ✗ ✗✗ ✗ ✗ ✗(:) (:) (:) (:)✗ ✗ ✗ ✗✗ ✗ ✗ ✗✗ ✗ ✗ ✗Large city(> 1 000 000 <strong>in</strong>habitants)%ISLINO(:) (:) (:) (:)BGRO0 1020 30 40 50 60 70 80 90 100 0 10 20 30 40 50 60 0 10 20 30 40 50 0 10 20 30 40 50 60 70%Native pupils <strong>Immigrant</strong> Countries not hav<strong>in</strong>g participated <strong>in</strong> the data collection No towns of this sizeBE BE UK% fr nl CZ DK DE EL ES FR IE IT LV LU HU NL AT PL PT FI SE ENG NIR SCT IS LI NO BG RONative pupilsVillage 35.6 28.1 33.1 57.2 36.4 21.6 20.7 29.9 60.6 18.3 (:) 35.1 18.3 (:) 44.5 19.5 40.7 39.2 51.3 29.5 41.4 43.0 (:) 100 68.0 16.3 23.6Small town 37.4 60.3 36.5 26.0 41.8 46.8 32.8 51.6 13.5 52.1 (:) 18.4 40.2 (:) 27.4 40.7 38.0 33.4 33.8 37.9 30.3 36.4 (:) 21.7 34.6 30.6Town/city 27.0 11.2 16.9 6.5 15.9 17.2 36.8 14.8 7.7 18.0 (:) 46.5 21.9 (:) 14.5 31.5 13.6 7.0 9.1 18.0 25.0 18.8 (:) 10.4 38.1 38.6Large city 0.0 0.4 13.5 10.4 5.9 14.4 9.7 3.8 18.2 11.6 (:) 19.6 (:) 13.6 8.3 7.7 20.4 5.8 14.6 3.4 1.8 (:) 11.0 7.3<strong>Immigrant</strong>Village 16.8 17.3 16.7 22.1 28.2 12.1 23.3 18.3 52.9 16.5 (:) 25.7 12.5 (:) 19.9 16.4 28.0 11.1 25.2 7.9 43.5 22.8 (:) 100 39.6 31.8 15.4Small town 27.4 56.8 59.3 29.1 38.7 29.8 26.5 58.6 26.0 42.6 (:) 18.1 31.6 (:) 22.6 36.4 28.9 12.6 37.0 18.2 25.7 17.8 (:) 30.0 24.6 51.8Town/city 55.8 17.1 16.7 12.3 27.4 16.9 24.5 16.7 1.2 17.3 (:) 56.2 24.2 (:) 18.1 47.3 23.2 7.5 22.0 30.1 23.2 41.9 (:) 30.4 22.7 17.4Large city 0.0 8.8 7.4 36.5 5.7 41.2 25.7 6.4 20.0 23.6 (:) 31.7 (:) 39.4 0.0 19.9 68.9 15.8 43.8 7.5 17.5 (:) 21.0 15.4Source: OECD, PISA 2000 database.Additional notesLatvia: Data were not considered to be representative of the situation at national level and were therefore excluded.Netherlands: The response rate to the PISA 2000 survey was considered to be too low for purposes of mean<strong>in</strong>gfulcomparison. This is why the data (native pupils: village = 12.9; small town = 62.0; town/city = 25.1; large city = notows of this size. <strong>Immigrant</strong>s: village = 4.1; small town = 40.9; town/city = 55.1; large city = no towns of this size) arenot shown <strong>in</strong> the Figure. See the glossary for further details.Explanatory noteThe group referred to as immigrants corresponds to replies of the type ‘both parents and the 15-year-old pupil bornabroad’ or ‘both parents born abroad and the 15-year-old pupil born <strong>in</strong> the country concerned’. The group referredto as natives corresponds to replies of the type ‘one parent born abroad’ and ‘both parents born <strong>in</strong> the countryconcerned’, irrespective of the pupil’s place of birth.28