Integrating Immigrant Children into Schools in Europe
Integrating Immigrant Children into Schools in Europe
Integrating Immigrant Children into Schools in Europe

Create successful ePaper yourself
Turn your PDF publications into a flip-book with our unique Google optimized e-Paper software.
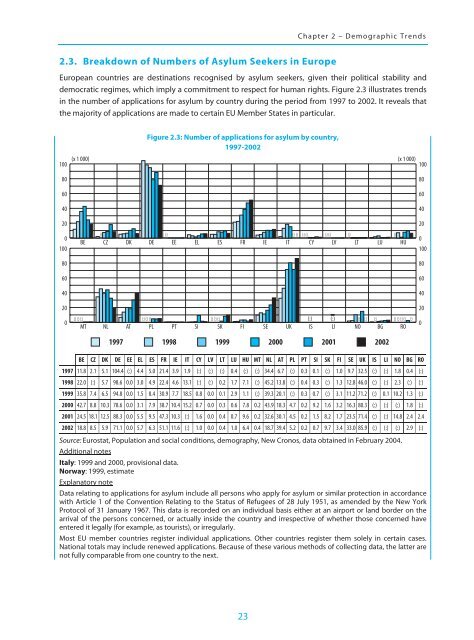
Chapter 2 – Demographic Trends2.3. Breakdown of Numbers of Asylum Seekers <strong>in</strong> <strong>Europe</strong><strong>Europe</strong>an countries are dest<strong>in</strong>ations recognised by asylum seekers, given their political stability anddemocratic regimes, which imply a commitment to respect for human rights. Figure 2.3 illustrates trends<strong>in</strong> the number of applications for asylum by country dur<strong>in</strong>g the period from 1997 to 2002. It reveals thatthe majority of applications are made to certa<strong>in</strong> EU Member States <strong>in</strong> particular.100806040Figure 2.3: Number of applications for asylum by country,1997-2002(x 1 000) (x 1 000)10080604020200100BE(:) (:) (:) (:) (:) (:) (:) (:) (:) (:)CZ DK DE EE EL ES FR IE IT CY LV LT LUHU0100808060604040200(:) (:) (:) (:) (:) (:) (:) (:) (:) (:) (:)(:) (:) (:) (:) (:) (:) (:) (:)MT NL AT PL PT SI SK FI SE UK IS LI NO BG RO1997 1998 1999 2000 2001 2002200BE CZ DK DE EE EL ES FR IE IT CY LV LT LU HU MT NL AT PL PT SI SK FI SE UK IS LI NO BG RO1997 11.8 2.1 5.1 104.4 (:) 4.4 5.0 21.4 3.9 1.9 (:) (:) (:) 0.4 (:) (:) 34.4 6.7 (:) 0.3 0.1 (:) 1.0 9.7 32.5 (:) (:) 1.8 0.4 (:)1998 22.0 (:) 5.7 98.6 0.0 3.0 4.9 22.4 4.6 13.1 (:) (:) 0.2 1.7 7.1 (:) 45.2 13.8 (:) 0.4 0.3 (:) 1.3 12.8 46.0 (:) (:) 2.3 (:) (:)1999 35.8 7.4 6.5 94.8 0.0 1.5 8.4 30.9 7.7 18.5 0.8 0.0 0.1 2.9 1.1 (:) 39.3 20.1 (:) 0.3 0.7 (:) 3.1 11.2 71.2 (:) 0.1 10.2 1.3 (:)2000 42.7 8.8 10.3 78.6 0.0 3.1 7.9 38.7 10.4 15.2 0.7 0.0 0.3 0.6 7.8 0.2 43.9 18.3 4.7 0.2 9.2 1.6 3.2 16.3 80.3 (:) (:) (:) 1.8 (:)2001 24.5 18.1 12.5 88.3 0.0 5.5 9.5 47.3 10.3 (:) 1.6 0.0 0.4 0.7 9.6 0.2 32.6 30.1 4.5 0.2 1.5 8.2 1.7 23.5 71.4 (:) (:) 14.8 2.4 2.42002 18.8 8.5 5.9 71.1 0.0 5.7 6.3 51.1 11.6 (:) 1.0 0.0 0.4 1.0 6.4 0.4 18.7 39.4 5.2 0.2 0.7 9.7 3.4 33.0 85.9 (:) (:) (:) 2.9 (:)Source: Eurostat, Population and social conditions, demography, New Cronos, data obta<strong>in</strong>ed <strong>in</strong> February 2004.Additional notesItaly: 1999 and 2000, provisional data.Norway: 1999, estimateExplanatory noteData relat<strong>in</strong>g to applications for asylum <strong>in</strong>clude all persons who apply for asylum or similar protection <strong>in</strong> accordancewith Article 1 of the Convention Relat<strong>in</strong>g to the Status of Refugees of 28 July 1951, as amended by the New YorkProtocol of 31 January 1967. This data is recorded on an <strong>in</strong>dividual basis either at an airport or land border on thearrival of the persons concerned, or actually <strong>in</strong>side the country and irrespective of whether those concerned haveentered it legally (for example, as tourists), or irregularly.Most EU member countries register <strong>in</strong>dividual applications. Other countries register them solely <strong>in</strong> certa<strong>in</strong> cases.National totals may <strong>in</strong>clude renewed applications. Because of these various methods of collect<strong>in</strong>g data, the latter arenot fully comparable from one country to the next.23