Integrating Immigrant Children into Schools in Europe
Integrating Immigrant Children into Schools in Europe
Integrating Immigrant Children into Schools in Europe

Create successful ePaper yourself
Turn your PDF publications into a flip-book with our unique Google optimized e-Paper software.
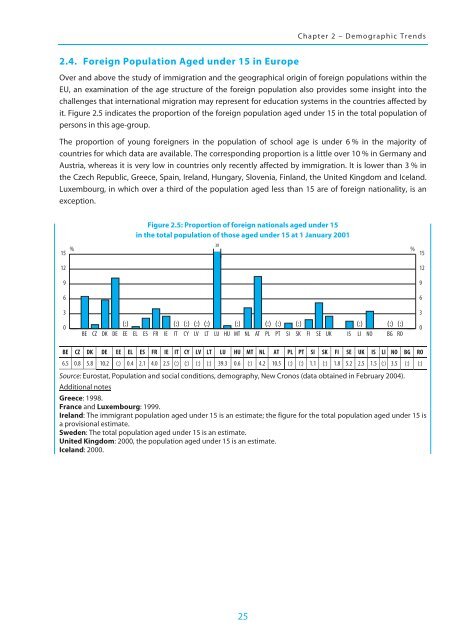
Chapter 2 – Demographic Trends2.4. Foreign Population Aged under 15 <strong>in</strong> <strong>Europe</strong>Over and above the study of immigration and the geographical orig<strong>in</strong> of foreign populations with<strong>in</strong> theEU, an exam<strong>in</strong>ation of the age structure of the foreign population also provides some <strong>in</strong>sight <strong><strong>in</strong>to</strong> thechallenges that <strong>in</strong>ternational migration may represent for education systems <strong>in</strong> the countries affected byit. Figure 2.5 <strong>in</strong>dicates the proportion of the foreign population aged under 15 <strong>in</strong> the total population ofpersons <strong>in</strong> this age-group.The proportion of young foreigners <strong>in</strong> the population of school age is under 6 % <strong>in</strong> the majority ofcountries for which data are available. The correspond<strong>in</strong>g proportion is a little over 10 % <strong>in</strong> Germany andAustria, whereas it is very low <strong>in</strong> countries only recently affected by immigration. It is lower than 3 % <strong>in</strong>the Czech Republic, Greece, Spa<strong>in</strong>, Ireland, Hungary, Slovenia, F<strong>in</strong>land, the United K<strong>in</strong>gdom and Iceland.Luxembourg, <strong>in</strong> which over a third of the population aged less than 15 are of foreign nationality, is anexception.15Figure 2.5: Proportion of foreign nationals aged under 15<strong>in</strong> the total population of those aged under 15 at 1 January 200139% %1512129966330BECZDKDE(:) (:) (:) (:) (:) (:) (:) (:) (:) (:) (:) (:)EE EL ES FR IE IT CY LV LT LU HU MT NL AT PL PT SI SK FI SE UK IS LI NO BG RO0BE CZ DK DE EE EL ES FR IE IT CY LV LT LU HU MT NL AT PL PT SI SK FI SE UK IS LI NO BG RO6.5 0.8 5.8 10.2 (:) 0.4 2.1 4.0 2.5 (:) (:) (:) (:) 39.3 0.6 (:) 4.2 10.5 (:) (:) 1.1 (:) 1.8 5.2 2.5 1.5 (:) 3.5 (:) (:)Source: Eurostat, Population and social conditions, demography, New Cronos (data obta<strong>in</strong>ed <strong>in</strong> February 2004).Additional notesGreece: 1998.France and Luxembourg: 1999.Ireland: The immigrant population aged under 15 is an estimate; the figure for the total population aged under 15 isa provisional estimate.Sweden: The total population aged under 15 is an estimate.United K<strong>in</strong>gdom: 2000, the population aged under 15 is an estimate.Iceland: 2000.25