Integrating Immigrant Children into Schools in Europe
Integrating Immigrant Children into Schools in Europe
Integrating Immigrant Children into Schools in Europe

Create successful ePaper yourself
Turn your PDF publications into a flip-book with our unique Google optimized e-Paper software.
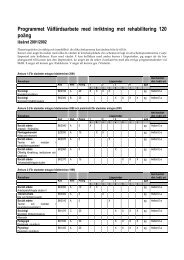
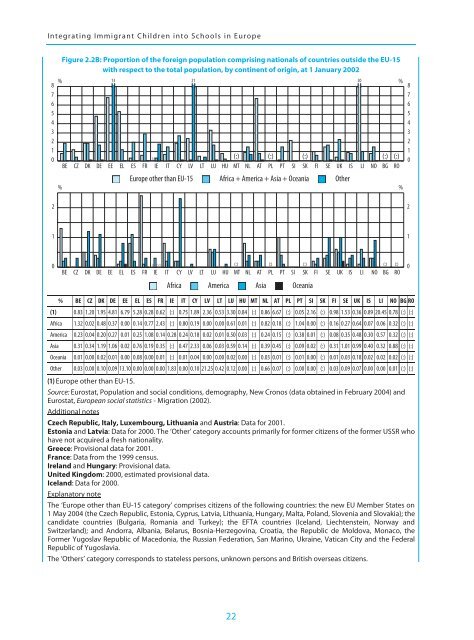
<strong>Integrat<strong>in</strong>g</strong> <strong>Immigrant</strong> <strong>Children</strong> <strong><strong>in</strong>to</strong> <strong>Schools</strong> <strong>in</strong> <strong>Europe</strong>876543210Figure 2.2B: Proportion of the foreign population compris<strong>in</strong>g nationals of countries outside the EU-15with respect to the total population, by cont<strong>in</strong>ent of orig<strong>in</strong>, at 1 January 2002% 13 21 20%BECZDKDEEEELESFR(:)IEITCYLVLTLU(:) (:) (:) (:) (:)HU MT NL AT PL PT SI SK FI SE UK IS LI NO BG RO<strong>Europe</strong> other than EU-15 Africa + America + Asia + Oceania Other% %87654321022110BECZDKDEEEELESFR(:) (:) (:)IEITCYLVLTLUHU(:) (:) (:) (:) (:)MT NL AT PL PT SI SK FI SE UK IS LI NO BG RO0Africa America Asia Oceania% BE CZ DK DE EE EL ES FR IE IT CY LV LT LU HU MT NL AT PL PT SI SK FI SE UK IS LI NO BG RO(1) 0.83 1.20 1.95 4.81 6.79 5.28 0.28 0.62 (:) 0.75 1.89 2.36 0.53 3.30 0.84 (:) 0.86 6.67 (:) 0.05 2.16 (:) 0.98 1.53 0.36 0.89 20.45 0.78 (:) (:)Africa 1.32 0.02 0.48 0.37 0.00 0.14 0.77 2.43 (:) 0.80 0.19 0.00 0.00 0.61 0.01 (:) 0.82 0.18 (:) 1.04 0.00 (:) 0.16 0.27 0.64 0.07 0.06 0.32 (:) (:)America 0.23 0.04 0.20 0.27 0.01 0.25 1.08 0.14 0.28 0.24 0.18 0.02 0.01 0.50 0.03 (:) 0.24 0.15 (:) 0.38 0.01 (:) 0.08 0.35 0.48 0.30 0.57 0.32 (:) (:)Asia 0.31 0.34 1.19 1.06 0.02 0.76 0.19 0.35 (:) 0.47 2.33 0.06 0.03 0.59 0.14 (:) 0.39 0.45 (:) 0.09 0.02 (:) 0.31 1.01 0.99 0.40 0.32 0.88 (:) (:)Oceania 0.01 0.00 0.02 0.01 0.00 0.08 0.00 0.01 (:) 0.01 0.04 0.00 0.00 0.02 0.00 (:) 0.03 0.01 (:) 0.01 0.00 (:) 0.01 0.03 0.18 0.02 0.02 0.02 (:) (:)Other 0.03 0.00 0.10 0.09 13.10 0.00 0.00 0.00 1.83 0.00 0.10 21.25 0.42 0.12 0.00 (:) 0.66 0.07 (:) 0.00 0.00 (:) 0.03 0.09 0.07 0.00 0.00 0.01 (:) (:)(1) <strong>Europe</strong> other than EU-15.Source: Eurostat, Population and social conditions, demography, New Cronos (data obta<strong>in</strong>ed <strong>in</strong> February 2004) andEurostat, <strong>Europe</strong>an social statistics - Migration (2002).Additional notesCzech Republic, Italy, Luxembourg, Lithuania and Austria: Data for 2001.Estonia and Latvia: Data for 2000. The ‘Other’ category accounts primarily for former citizens of the former USSR whohave not acquired a fresh nationality.Greece: Provisional data for 2001.France: Data from the 1999 census.Ireland and Hungary: Provisional data.United K<strong>in</strong>gdom: 2000, estimated provisional data.Iceland: Data for 2000.Explanatory noteThe ‘<strong>Europe</strong> other than EU-15 category’ comprises citizens of the follow<strong>in</strong>g countries: the new EU Member States on1 May 2004 (the Czech Republic, Estonia, Cyprus, Latvia, Lithuania, Hungary, Malta, Poland, Slovenia and Slovakia); thecandidate countries (Bulgaria, Romania and Turkey); the EFTA countries (Iceland, Liechtenste<strong>in</strong>, Norway andSwitzerland); and Andorra, Albania, Belarus, Bosnia-Herzegov<strong>in</strong>a, Croatia, the Republic de Moldova, Monaco, theFormer Yugoslav Republic of Macedonia, the Russian Federation, San Mar<strong>in</strong>o, Ukra<strong>in</strong>e, Vatican City and the FederalRepublic of Yugoslavia.The ‘Others’ category corresponds to stateless persons, unknown persons and British overseas citizens.22