Integrating Immigrant Children into Schools in Europe
Integrating Immigrant Children into Schools in Europe
Integrating Immigrant Children into Schools in Europe

You also want an ePaper? Increase the reach of your titles
YUMPU automatically turns print PDFs into web optimized ePapers that Google loves.
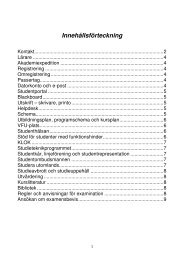
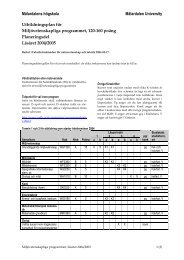
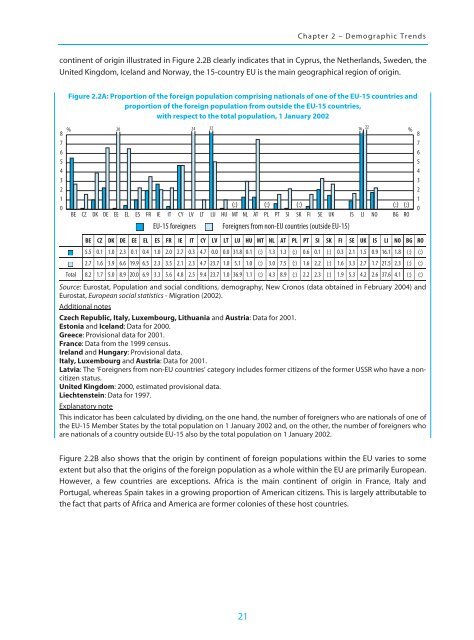
Chapter 2 – Demographic Trendscont<strong>in</strong>ent of orig<strong>in</strong> illustrated <strong>in</strong> Figure 2.2B clearly <strong>in</strong>dicates that <strong>in</strong> Cyprus, the Netherlands, Sweden, theUnited K<strong>in</strong>gdom, Iceland and Norway, the 15-country EU is the ma<strong>in</strong> geographical region of orig<strong>in</strong>.876543210Figure 2.2A: Proportion of the foreign population compris<strong>in</strong>g nationals of one of the EU-15 countries andproportion of the foreign population from outside the EU-15 countries,with respect to the total population, 1 January 20022024 32 16 22% %BECZDKDEEEELESFRIEITCYLVEU-15 foreignersLTLU(:) (:) (:) (:) (:)HU MT NL AT PL PT SI SK FI SE UK IS LI NO BG ROForeigners from non-EU countries (outside EU-15)BE CZ DK DE EE EL ES FR IE IT CY LV LT LU HU MT NL AT PL PT SI SK FI SE UK IS LI NO BG RO5.5 0.1 1.0 2.3 0.1 0.4 1.0 2.0 2.7 0.3 4.7 0.0 0.0 31.8 0.1 (:) 1.3 1.3 (:) 0.6 0.1 (:) 0.3 2.1 1.5 0.9 16.1 1.8 (:) (:)2.7 1.6 3.9 6.6 19.9 6.5 2.3 3.5 2.1 2.3 4.7 23.7 1.0 5.1 1.0 (:) 3.0 7.5 (:) 1.6 2.2 (:) 1.6 3.3 2.7 1.7 21.5 2.3 (:) (:)Total 8.2 1.7 5.0 8.9 20.0 6.9 3.3 5.6 4.8 2.5 9.4 23.7 1.0 36.9 1.1 (:) 4.3 8.9 (:) 2.2 2.3 (:) 1.9 5.3 4.2 2.6 37.6 4.1 (:) (:)Source: Eurostat, Population and social conditions, demography, New Cronos (data obta<strong>in</strong>ed <strong>in</strong> February 2004) andEurostat, <strong>Europe</strong>an social statistics - Migration (2002).Additional notesCzech Republic, Italy, Luxembourg, Lithuania and Austria: Data for 2001.Estonia and Iceland: Data for 2000.Greece: Provisional data for 2001.France: Data from the 1999 census.Ireland and Hungary: Provisional data.Italy, Luxembourg and Austria: Data for 2001.Latvia: The ‘Foreigners from non-EU countries’ category <strong>in</strong>cludes former citizens of the former USSR who have a noncitizenstatus.United K<strong>in</strong>gdom: 2000, estimated provisional data.Liechtenste<strong>in</strong>: Data for 1997.Explanatory noteThis <strong>in</strong>dicator has been calculated by divid<strong>in</strong>g, on the one hand, the number of foreigners who are nationals of one ofthe EU-15 Member States by the total population on 1 January 2002 and, on the other, the number of foreigners whoare nationals of a country outside EU-15 also by the total population on 1 January 2002.876543210Figure 2.2B also shows that the orig<strong>in</strong> by cont<strong>in</strong>ent of foreign populations with<strong>in</strong> the EU varies to someextent but also that the orig<strong>in</strong>s of the foreign population as a whole with<strong>in</strong> the EU are primarily <strong>Europe</strong>an.However, a few countries are exceptions. Africa is the ma<strong>in</strong> cont<strong>in</strong>ent of orig<strong>in</strong> <strong>in</strong> France, Italy andPortugal, whereas Spa<strong>in</strong> takes <strong>in</strong> a grow<strong>in</strong>g proportion of American citizens. This is largely attributable tothe fact that parts of Africa and America are former colonies of these host countries.21