Integrating Immigrant Children into Schools in Europe
Integrating Immigrant Children into Schools in Europe
Integrating Immigrant Children into Schools in Europe

Create successful ePaper yourself
Turn your PDF publications into a flip-book with our unique Google optimized e-Paper software.
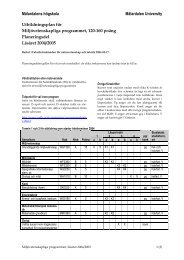
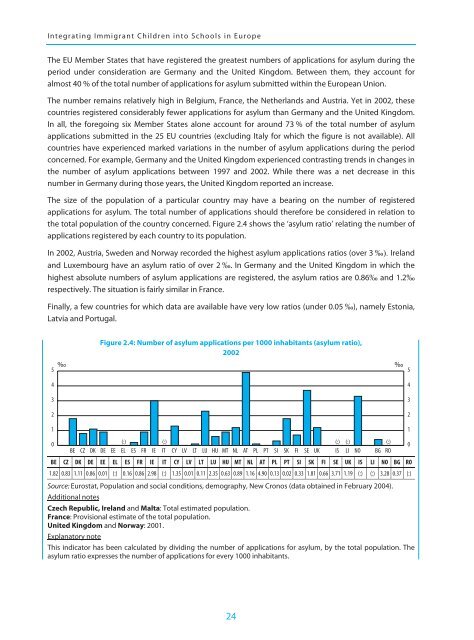
<strong>Integrat<strong>in</strong>g</strong> <strong>Immigrant</strong> <strong>Children</strong> <strong><strong>in</strong>to</strong> <strong>Schools</strong> <strong>in</strong> <strong>Europe</strong>The EU Member States that have registered the greatest numbers of applications for asylum dur<strong>in</strong>g theperiod under consideration are Germany and the United K<strong>in</strong>gdom. Between them, they account foralmost 40 % of the total number of applications for asylum submitted with<strong>in</strong> the <strong>Europe</strong>an Union.The number rema<strong>in</strong>s relatively high <strong>in</strong> Belgium, France, the Netherlands and Austria. Yet <strong>in</strong> 2002, thesecountries registered considerably fewer applications for asylum than Germany and the United K<strong>in</strong>gdom.In all, the forego<strong>in</strong>g six Member States alone account for around 73 % of the total number of asylumapplications submitted <strong>in</strong> the 25 EU countries (exclud<strong>in</strong>g Italy for which the figure is not available). Allcountries have experienced marked variations <strong>in</strong> the number of asylum applications dur<strong>in</strong>g the periodconcerned. For example, Germany and the United K<strong>in</strong>gdom experienced contrast<strong>in</strong>g trends <strong>in</strong> changes <strong>in</strong>the number of asylum applications between 1997 and 2002. While there was a net decrease <strong>in</strong> thisnumber <strong>in</strong> Germany dur<strong>in</strong>g those years, the United K<strong>in</strong>gdom reported an <strong>in</strong>crease.The size of the population of a particular country may have a bear<strong>in</strong>g on the number of registeredapplications for asylum. The total number of applications should therefore be considered <strong>in</strong> relation tothe total population of the country concerned. Figure 2.4 shows the ‘asylum ratio’ relat<strong>in</strong>g the number ofapplications registered by each country to its population.In 2002, Austria, Sweden and Norway recorded the highest asylum applications ratios (over 3 ‰). Irelandand Luxembourg have an asylum ratio of over 2 ‰. In Germany and the United K<strong>in</strong>gdom <strong>in</strong> which thehighest absolute numbers of asylum applications are registered, the asylum ratios are 0.86‰ and 1.2‰respectively. The situation is fairly similar <strong>in</strong> France.F<strong>in</strong>ally, a few countries for which data are available have very low ratios (under 0.05 ‰), namely Estonia,Latvia and Portugal.5432Figure 2.4: Number of asylum applications per 1000 <strong>in</strong>habitants (asylum ratio),2002‰ ‰543210BECZDKDEEE(:) (:) (:) (:) (:)EL ES FR IE IT CY LV LT LU HU MT NL AT PL PT SI SK FI SE UK IS LI NO BG ROBE CZ DK DE EE EL ES FR IE IT CY LV LT LU HU MT NL AT PL PT SI SK FI SE UK IS LI NO BG RO1.82 0.83 1.11 0.86 0.01 (:) 0.16 0.86 2.98 (:) 1.35 0.01 0.11 2.35 0.63 0.89 1.16 4.90 0.13 0.02 0.33 1.81 0.66 3.71 1.19 (:) (:) 3.28 0.37 (:)Source: Eurostat, Population and social conditions, demography, New Cronos (data obta<strong>in</strong>ed <strong>in</strong> February 2004).Additional notesCzech Republic, Ireland and Malta: Total estimated population.France: Provisional estimate of the total population.United K<strong>in</strong>gdom and Norway: 2001.Explanatory noteThis <strong>in</strong>dicator has been calculated by divid<strong>in</strong>g the number of applications for asylum, by the total population. Theasylum ratio expresses the number of applications for every 1000 <strong>in</strong>habitants.1024