Good Health Can’t Wait.

Create successful ePaper yourself
Turn your PDF publications into a flip-book with our unique Google optimized e-Paper software.
Consolidated Financial Statements<br />
Annual Report 2014 - 15<br />
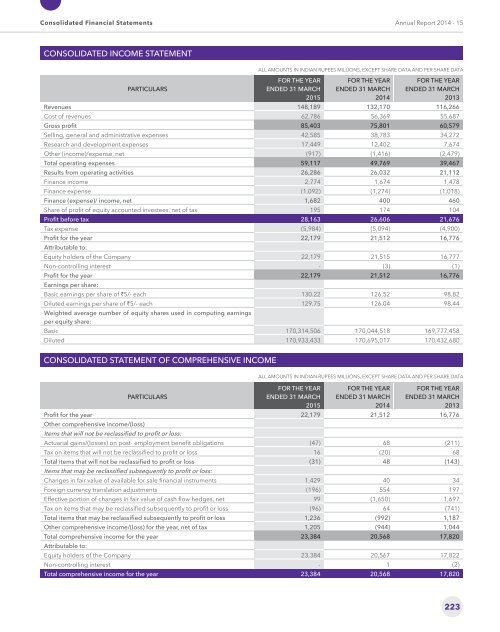
CONSOLIDATED INCOME STATEMENT<br />
PARTICULARS<br />
ALL AMOUNTS IN INDIAN RUPEES MILLIONS, EXCEPT SHARE DATA AND PER SHARE DATA<br />
FOR THE YEAR<br />
ENDED 31 MARCH<br />
2015<br />
FOR THE YEAR<br />
ENDED 31 MARCH<br />
2014<br />
FOR THE YEAR<br />
ENDED 31 MARCH<br />
2013<br />
Revenues 148,189 132,170 116,266<br />
Cost of revenues 62,786 56,369 55,687<br />
Gross profit 85,403 75,801 60,579<br />
Selling, general and administrative expenses 42,585 38,783 34,272<br />
Research and development expenses 17,449 12,402 7,674<br />
Other (income)/expense, net (917) (1,416) (2,479)<br />
Total operating expenses 59,117 49,769 39,467<br />
Results from operating activities 26,286 26,032 21,112<br />
Finance income 2,774 1,674 1,478<br />
Finance expense (1,092) (1,274) (1,018)<br />
Finance (expense)/ income, net 1,682 400 460<br />
Share of profit of equity accounted investees, net of tax 195 174 104<br />
Profit before tax 28,163 26,606 21,676<br />
Tax expense (5,984) (5,094) (4,900)<br />
Profit for the year 22,179 21,512 16,776<br />
Attributable to:<br />
Equity holders of the Company 22,179 21,515 16,777<br />
Non-controlling interest - (3) (1)<br />
Profit for the year 22,179 21,512 16,776<br />
Earnings per share:<br />
Basic earnings per share of `5/- each 130.22 126.52 98.82<br />
Diluted earnings per share of `5/- each 129.75 126.04 98.44<br />
Weighted average number of equity shares used in computing earnings<br />
per equity share:<br />
Basic 170,314,506 170,044,518 169,777,458<br />
Diluted 170,933,433 170,695,017 170,432,680<br />
CONSOLIDATED STATEMENT OF COMPREHENSIVE INCOME<br />
PARTICULARS<br />
ALL AMOUNTS IN INDIAN RUPEES MILLIONS, EXCEPT SHARE DATA AND PER SHARE DATA<br />
FOR THE YEAR<br />
ENDED 31 MARCH<br />
2015<br />
FOR THE YEAR<br />
ENDED 31 MARCH<br />
2014<br />
FOR THE YEAR<br />
ENDED 31 MARCH<br />
2013<br />
Profit for the year 22,179 21,512 16,776<br />
Other comprehensive income/(loss) <br />
Items that will not be reclassified to profit or loss:<br />
Actuarial gains/(losses) on post- employment benefit obligations (47) 68 (211)<br />
Tax on items that will not be reclassified to profit or loss 16 (20) 68<br />
Total items that will not be reclassified to profit or loss (31) 48 (143)<br />
Items that may be reclassified subsequently to profit or loss:<br />
Changes in fair value of available for sale financial instruments 1,429 40 34<br />
Foreign currency translation adjustments (196) 554 197<br />
Effective portion of changes in fair value of cash flow hedges, net 99 (1,650) 1,697<br />
Tax on items that may be reclassified subsequently to profit or loss (96) 64 (741)<br />
Total items that may be reclassified subsequently to profit or loss 1,236 (992) 1,187<br />
Other comprehensive income/(loss) for the year, net of tax 1,205 (944) 1,044<br />
Total comprehensive income for the year 23,384 20,568 17,820<br />
Attributable to: <br />
Equity holders of the Company 23,384 20,567 17,822<br />
Non-controlling interest - 1 (2)<br />
Total comprehensive income for the year 23,384 20,568 17,820<br />
223