Good Health Can’t Wait.
Create successful ePaper yourself
Turn your PDF publications into a flip-book with our unique Google optimized e-Paper software.
Statutory Reports • Management Discussion and Analysis Annual Report 2014 - 15<br />
PSAI BUSINESS<br />
HIGHLIGHTS FY2015<br />
` 25.46 bn<br />
6%<br />
REVENUE<br />
17% of Dr. Reddy’s total revenues.<br />
41%<br />
REVENUE FROM EUROPE<br />
MARGIN IMPROVEMENT<br />
Despite relatively low top-line growth,<br />
PSAI showed significant margin<br />
improvement thanks to a better<br />
product mix.<br />
77<br />
DMFs FILED GLOBALLY<br />
Including 12 in the US and 16 in<br />
Europe. Cumulatively, there were 735<br />
DMF filings as of 31 March 2015.<br />
imports. Despite uncertainties, we<br />
continue to remain positive about our<br />
therapy focused first to market approach<br />
in this market.<br />
PHARMACEUTICAL SERVICES AND<br />
ACTIVE INGREDIENTS (PSAI)<br />
Our PSAI segment includes active<br />
pharmaceutical ingredients,<br />
intermediates and contract research<br />
services business.<br />
The latest report from Transparency<br />
Market Research on active<br />
pharmaceutical ingredients (API)<br />
suggests that the segment, currently<br />
valued at approximately US$120 billion,<br />
is anticipated to grow at a CAGR of<br />
7% to reach US$180 billion by 2020.<br />
There has also been an increase in the<br />
influence of API players from emerging<br />
economies, especially India and China,<br />
which is expected to continue going<br />
forward.<br />
Although the life cycle of API emulates<br />
that of a commodity business, we expect<br />
our PSAI segment to show growth thanks<br />
to our investments in newer technologies<br />
and platforms of the future. We are also<br />
pursuing a partnership model to enable<br />
our customers to reach more markets<br />
faster and efficiently by leveraging our<br />
cost leadership and presence across<br />
the globe. We continue to be one of the<br />
significant API players in the industry,<br />
supporting internally as well as global<br />
customers such as Teva, Mylan, Sandoz,<br />
Actavis among others. Over one-third of<br />
our API sales in FY2015 were to the top<br />
five generics players in the world.<br />
FINANCIALS<br />
CONSOLIDATED FINANCIALS<br />
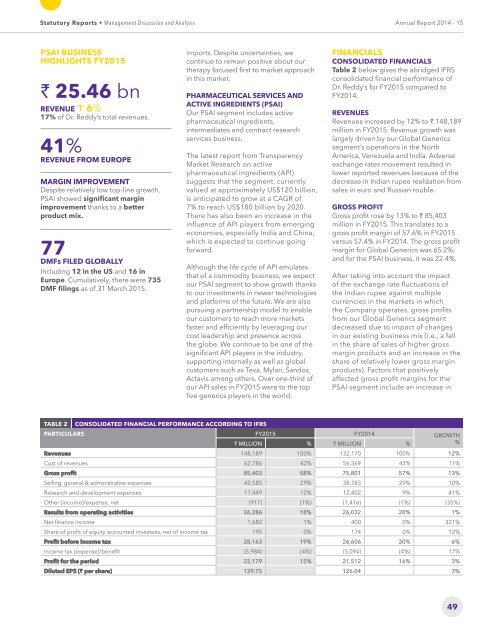
Table 2 below gives the abridged IFRS<br />
consolidated financial performance of<br />
Dr. Reddy’s for FY2015 compared to<br />
FY2014.<br />
REVENUES<br />
Revenues increased by 12% to ` 148,189<br />
million in FY2015. Revenue growth was<br />
largely driven by our Global Generics<br />
segment’s operations in the North<br />
America, Venezuela and India. Adverse<br />
exchange rates movement resulted in<br />
lower reported revenues because of the<br />
decrease in Indian rupee realization from<br />
sales in euro and Russian rouble.<br />
GROSS PROFIT<br />
Gross profit rose by 13% to ` 85,403<br />
million in FY2015. This translates to a<br />
gross profit margin of 57.6% in FY2015<br />
versus 57.4% in FY2014. The gross profit<br />
margin for Global Generics was 65.2%;<br />
and for the PSAI business, it was 22.4%.<br />
After taking into account the impact<br />
of the exchange rate fluctuations of<br />
the Indian rupee against multiple<br />
currencies in the markets in which<br />
the Company operates, gross profits<br />
from our Global Generics segment<br />
decreased due to impact of changes<br />
in our existing business mix (i.e., a fall<br />
in the share of sales of higher gross<br />
margin products and an increase in the<br />
share of relatively lower gross margin<br />
products). Factors that positively<br />
affected gross profit margins for the<br />
PSAI segment include an increase in<br />
TABLE 2 CONSOLIDATED FINANCIAL PERFORMANCE ACCORDING TO IFRS<br />
PARTICULARS FY2015 FY2014 GROWTH<br />
` MILLION % W` MILLION %<br />
%<br />
Revenues 148,189 100% 132,170 100% 12%<br />
Cost of revenues 62,786 42% 56,369 43% 11%<br />
Gross profit 85,403 58% 75,801 57% 13%<br />
Selling, general & administrative expenses 42,585 29% 38,783 29% 10%<br />
Research and development expenses 17,449 12% 12,402 9% 41%<br />
Other (income)/expense, net (917) (1%) (1,416) (1%) (35%)<br />
Results from operating activities 26,286 18% 26,032 20% 1%<br />
Net finance income 1,682 1% 400 0% 321%<br />
Share of profit of equity accounted investees, net of income tax 195 0% 174 0% 12%<br />
Profit before income tax 28,163 19% 26,606 20% 6%<br />
Income tax (expense)/benefit (5,984) (4%) (5,094) (4%) 17%<br />
Profit for the period 22,179 15% 21,512 16% 3%<br />
Diluted EPS (` per share) 129.75 126.04 3%<br />
49


