Good Health Can’t Wait.

You also want an ePaper? Increase the reach of your titles
YUMPU automatically turns print PDFs into web optimized ePapers that Google loves.
<strong>Good</strong> <strong>Health</strong> <strong>Can’t</strong> <strong>Wait</strong>.<br />
Dr. Reddy’s Laboratories Limited<br />
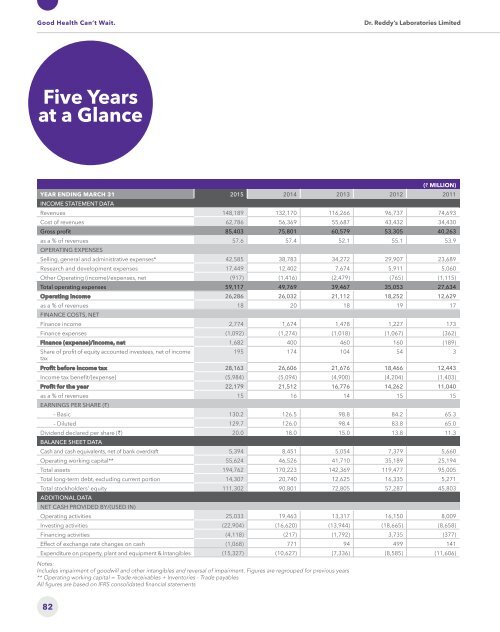
Five Years<br />
at a Glance<br />
(` MILLION)<br />
YEAR ENDING MARCH 31 2015 2014 2013 2012 2011<br />
INCOME STATEMENT DATA<br />
Revenues 148,189 132,170 116,266 96,737 74,693<br />
Cost of revenues 62,786 56,369 55,687 43,432 34,430<br />
Gross profit 85,403 75,801 60,579 53,305 40,263<br />
as a % of revenues 57.6 57.4 52.1 55.1 53.9<br />
OPERATING EXPENSES<br />
Selling, general and administrative expenses* 42,585 38,783 34,272 29,907 23,689<br />
Research and development expenses 17,449 12,402 7,674 5,911 5,060<br />
Other Operating (income)/expenses, net (917) (1,416) (2,479) (765) (1,115)<br />
Total operating expenses 59,117 49,769 39,467 35,053 27,634<br />
Operating income 26,286 26,032 21,112 18,252 12,629<br />
as a % of revenues 18 20 18 19 17<br />
FINANCE COSTS, NET<br />
Finance income 2,774 1,674 1,478 1,227 173<br />
Finance expenses (1,092) (1,274) (1,018) (1,067) (362)<br />
Finance (expense)/income, net 1,682 400 460 160 (189)<br />
Share of profit of equity accounted investees, net of income<br />
195 174 104 54 3<br />
tax<br />
Profit before income tax 28,163 26,606 21,676 18,466 12,443<br />
Income tax benefit/(expense) (5,984) (5,094) (4,900) (4,204) (1,403)<br />
Profit for the year 22,179 21,512 16,776 14,262 11,040<br />
as a % of revenues 15 16 14 15 15<br />
EARNINGS PER SHARE (`)<br />
– Basic 130.2 126.5 98.8 84.2 65.3<br />
– Diluted 129.7 126.0 98.4 83.8 65.0<br />
Dividend declared per share (`) 20.0 18.0 15.0 13.8 11.3<br />
BALANCE SHEET DATA<br />
Cash and cash equivalents, net of bank overdraft 5,394 8,451 5,054 7,379 5,660<br />
Operating working capital** 55,624 46,526 41,710 35,189 25,194<br />
Total assets 194,762 170,223 142,369 119,477 95,005<br />
Total long-term debt, excluding current portion 14,307 20,740 12,625 16,335 5,271<br />
Total stockholders' equity 111,302 90,801 72,805 57,287 45,803<br />
ADDITIONAL DATA<br />
NET CASH PROVIDED BY/(USED IN)<br />
Operating activities 25,033 19,463 13,317 16,150 8,009<br />
Investing activities (22,904) (16,620) (13,944) (18,665) (8,658)<br />
Financing activities (4,118) (217) (1,792) 3,735 (377)<br />
Effect of exchange rate changes on cash (1,068) 771 94 499 141<br />
Expenditure on property, plant and equipment & Intangibles (15,327) (10,627) (7,336) (8,585) (11,606)<br />
Notes:<br />
Includes impairment of goodwill and other intangibles and reversal of impairment. Figures are regrouped for previous years<br />
** Operating working capital = Trade receivables + Inventories - Trade payables<br />
All figures are based on IFRS consolidated financial statements<br />
82