- Page 7:
6 Strehlerlead to possible death si
- Page 10 and 11:
Understanding Aging 9the intestine
- Page 12 and 13:
Understanding Aging 117. Do long-li
- Page 14 and 15:
Understanding Aging 13is, the great
- Page 16 and 17:
Understanding Aging 15While this re
- Page 18 and 19:
Understanding Aging 172. Pearl, R.
- Page 20 and 21:
Understanding Aging 1945. Perovic,
- Page 22 and 23: 24 Cristofalo, Volker, and Allenmen
- Page 24 and 25: 26 Cristofalo, Volker, and Allenrec
- Page 26 and 27: 28 Cristofalo, Volker, and Allenski
- Page 28 and 29: 30 Cristofalo, Volker, and AllenTab
- Page 30 and 31: 32 Cristofalo, Volker, and AllenTab
- Page 32 and 33: 34 Cristofalo, Volker, and AllenNa
- Page 34 and 35: 36 Cristofalo, Volker, and AllenTab
- Page 36 and 37: 38 Cristofalo, Volker, and Allentak
- Page 38 and 39: 40 Cristofalo, Volker, and Allenb.
- Page 40 and 41: 42 Cristofalo, Volker, and Allenand
- Page 42 and 43: 44 Cristofalo, Volker, and AllenRef
- Page 44 and 45: 46 Cristofalo, Volker, and Allen33.
- Page 46 and 47: 48 Cristofalo, Volker, and Allen61.
- Page 48 and 49: 50 Cristofalo, Volker, and Allenhum
- Page 50 and 51: 52 Cristofalo, Volker, and Allen125
- Page 52 and 53: 54 Pawelecdiluted cells on an irrad
- Page 54 and 55: 56 Pawelec3. Method3.1. Source of C
- Page 56 and 57: 58 Pawelecweekly or fortnightly sub
- Page 58 and 59: 60 Pawelection, the VERUM Foundatio
- Page 60 and 61: Telomeres and Replicative Senescenc
- Page 62 and 63: Telomeres and Replicative Senescenc
- Page 64 and 65: Telomeres and Replicative Senescenc
- Page 66 and 67: Telomeres and Replicative Senescenc
- Page 68 and 69: Detection of Molecular Events 715De
- Page 70 and 71: Detection of Molecular Events 73hav
- Page 74 and 75: Detection of Molecular Events 772.
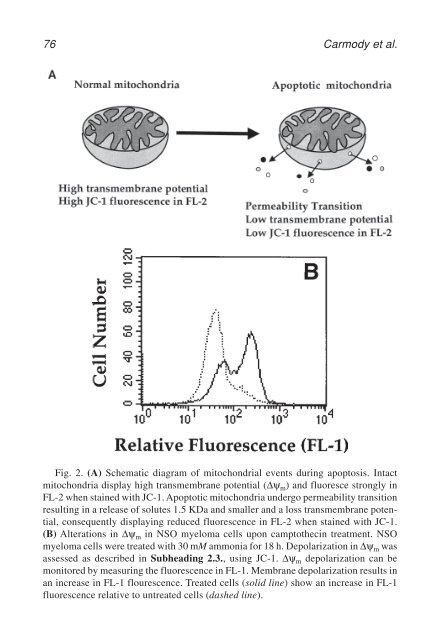
- Page 76 and 77: Detection of Molecular Events 79Fig
- Page 78 and 79: Detection of Molecular Events 814.
- Page 80 and 81: Detection of Molecular Events 8310.
- Page 82 and 83: 86 Kirk and Millerexperiments on un
- Page 84 and 85: 88 Kirk and MillerFig. 1. (A) Analy
- Page 86 and 87: 90 Kirk and MillerFurthermore, limi
- Page 88 and 89: 92 Kirk and Millersufficiently dilu
- Page 90 and 91: 94 Kirk and Miller4. Run samples on
- Page 92 and 93: 96 Kirk and Miller16. Lange-Carter,
- Page 94 and 95: 98 Engel, Adibzadeh, and PawelecPCR
- Page 96 and 97: 100 Engel, Adibzadeh, and Pawelec5.
- Page 98 and 99: 102 Engel, Adibzadeh, and PawelecTa
- Page 100 and 101: 104 Engel, Adibzadeh, and PawelecTa
- Page 102 and 103: 106 Engel, Adibzadeh, and Pawelecam
- Page 104 and 105: 108 Engel, Adibzadeh, and Pawelec3.
- Page 106 and 107: 110 Engel, Adibzadeh, and Pawelecfo
- Page 108 and 109: 112 Engel, Adibzadeh, and Pawelec5.
- Page 110 and 111: 114 Engel, Adibzadeh, and Pawelecha
- Page 112 and 113: Xenobiotic-Metabolizing Enzymes 119
- Page 114 and 115: Xenobiotic-Metabolizing Enzymes 121
- Page 116 and 117: Xenobiotic-Metabolizing Enzymes 123
- Page 118 and 119: Xenobiotic-Metabolizing Enzymes 125
- Page 120 and 121: Xenobiotic-Metabolizing Enzymes 127
- Page 122 and 123:
Xenobiotic-Metabolizing Enzymes 129
- Page 124 and 125:
Assessing Antioxidant Status 1339As
- Page 126 and 127:
Assessing Antioxidant Status 135Fig
- Page 128 and 129:
Assessing Antioxidant Status 137Tab
- Page 130 and 131:
Assessing Antioxidant Status 139add
- Page 132 and 133:
Assessing Antioxidant Status 14121.
- Page 134 and 135:
Comet Assay of DNA Damage 14310Meas
- Page 136 and 137:
Comet Assay of DNA Damage 145contro
- Page 138 and 139:
Comet Assay of DNA Damage 1476. Lys
- Page 140 and 141:
Comet Assay of DNA Damage 1494. Gen
- Page 142 and 143:
Comet Assay of DNA Damage 151anode
- Page 144 and 145:
Comet Assay of DNA Damage 1535. As
- Page 146 and 147:
Comet Assay of DNA Damage 15515. In
- Page 148 and 149:
Comet Assay of DNA Damage 15720. Co
- Page 150 and 151:
160 van der Schanswithin 1 h, after
- Page 152 and 153:
162 van der Schans10. High-binding
- Page 154 and 155:
164 van der Schans3. Neutralize aft
- Page 156 and 157:
166 van der SchansThe calculations
- Page 158 and 159:
8-oxoguanine Levels in Nuclear DNA
- Page 160 and 161:
8-oxoguanine Levels in Nuclear DNA
- Page 162 and 163:
8-oxoguanine Levels in Nuclear DNA
- Page 164 and 165:
8-oxoguanine Levels in Nuclear DNA
- Page 166 and 167:
Mutation and the Aging Process 1791
- Page 168 and 169:
Mutation and the Aging Process 181m
- Page 170 and 171:
Mutation and the Aging Process 183b
- Page 172 and 173:
Mutation and the Aging Process 1853
- Page 174 and 175:
Mutation and the Aging Process 1871
- Page 176 and 177:
190 HouThe HPRT mutational spectrum
- Page 178 and 179:
192 Houamplifications are carried o
- Page 180 and 181:
194 Hou4. Reading: Load 10 µL of t
- Page 182 and 183:
196 Hou4.2. MP-PCRUse preferably DN
- Page 184 and 185:
Susceptibility of LDL to Oxidation
- Page 186 and 187:
Susceptibility of LDL to Oxidation
- Page 188 and 189:
Susceptibility of LDL to Oxidation
- Page 190 and 191:
Susceptibility of LDL to Oxidation
- Page 192 and 193:
Susceptibility of LDL to Oxidation
- Page 194 and 195:
Analysis of Pentosidine 20916Measur
- Page 196 and 197:
Analysis of Pentosidine 211Fig. 2.
- Page 198 and 199:
Analysis of Pentosidine 213Fig. 4.
- Page 200 and 201:
Analysis of Pentosidine 2152. Preci
- Page 202 and 203:
Analysis of Pentosidine 2177. Nagar
- Page 204 and 205:
222 Miquellipoperoxides and malonal
- Page 206 and 207:
224 Miquelat 4°C. Protect this sol
- Page 208 and 209:
226 Miquel3.1. Animal AnesthesiaMed
- Page 210 and 211:
228 Miquelsteps to carry out a conv
- Page 212 and 213:
230 Miquelsuspending it over the so
- Page 214 and 215:
232 Miquelcontrast, washing with bu
- Page 216 and 217:
234 MiquelFig. 3. Electron microsco
- Page 218 and 219:
Damage to Mitochondria 23718Causes
- Page 220 and 221:
Damage to Mitochondria 239Fig. 1. E
- Page 222 and 223:
Damage to Mitochondria 2412. To obt
- Page 224 and 225:
Damage to Mitochondria 243synthesis
- Page 226 and 227:
Mitochondrial DNA Mutations 24519An
- Page 228 and 229:
Mitochondrial DNA Mutations 247F.P.
- Page 230 and 231:
Mitochondrial DNA Mutations 249desi
- Page 232 and 233:
Mitochondrial DNA Mutations 2514. M
- Page 234 and 235:
Mitochondrial DNA Mutations 253Fig.
- Page 236 and 237:
Mitochondrial DNA Mutations 25568°
- Page 238 and 239:
Mitochondrial DNA Mutations 257Fig.
- Page 240 and 241:
Mitochondrial DNA Mutations 2593. P
- Page 242 and 243:
Mitochondrial DNA Mutations 261X-10
- Page 244 and 245:
Mitochondrial DNA Mutations 26315.
- Page 246 and 247:
Mitochondrial DNA Mutations 26520An
- Page 248 and 249:
Mitochondrial DNA Mutations 267Tabl
- Page 250 and 251:
Mitochondrial DNA Mutations 269muta
- Page 252 and 253:
Mitochondrial DNA Mutations 2717. P
- Page 254 and 255:
Mitochondrial DNA Mutations 2733.2.
- Page 256 and 257:
Mitochondrial DNA Mutations 275that
- Page 258 and 259:
Mitochondrial DNA Mutations 27711.
- Page 260 and 261:
282 BeckmanWhatever the mechanism e
- Page 262 and 263:
284 BeckmanT-cell adherence to vasc
- Page 264 and 265:
286 BeckmanT3 hybridoma cells satis
- Page 266 and 267:
288 BeckmanHaving identified a cand
- Page 268 and 269:
290 Beckmanthe plates vigorously wi
- Page 270 and 271:
292 Grubeck-Loebenstein, Saurwein-T
- Page 272 and 273:
294 Grubeck-Loebenstein, Saurwein-T
- Page 274 and 275:
296 Grubeck-Loebenstein, Saurwein-T
- Page 276 and 277:
298 Grubeck-Loebenstein, Saurwein-T
- Page 278 and 279:
300 Grubeck-Loebenstein, Saurwein-T
- Page 280 and 281:
302 Grubeck-Loebenstein, Saurwein-T
- Page 282 and 283:
304 Grubeck-Loebenstein, Saurwein-T
- Page 284 and 285:
306 Grubeck-Loebenstein, Saurwein-T
- Page 286 and 287:
308 Grubeck-Loebenstein, Saurwein-T
- Page 288 and 289:
NK Cell Function in Aging 31123Age-
- Page 290 and 291:
NK Cell Function in Aging 3135. Pet
- Page 292 and 293:
NK Cell Function in Aging 31518. Io
- Page 294 and 295:
NK Cell Function in Aging 3173.3. C
- Page 296 and 297:
NK Cell Function in Aging 3199mL of
- Page 298 and 299:
Immunogenetics and Life-Span 32124I
- Page 300 and 301:
Immunogenetics and Life-Span 323Tab
- Page 302 and 303:
Immunogenetics and Life-Span 325rea
- Page 304 and 305:
Immunogenetics and Life-Span 3273.
- Page 306 and 307:
Immunogenetics and Life-Span 329Tab
- Page 308 and 309:
Immunogenetics and Life-Span 3313.5
- Page 310 and 311:
Immunogenetics and Life-Span 333Tab
- Page 312 and 313:
Immunogenetics and Life-Span 335Tab
- Page 314 and 315:
Immunogenetics and Life-Span 337Tab
- Page 316 and 317:
Immunogenetics and Life-Span 339Tab
- Page 318 and 319:
Immunogenetics and Life-Span 341Tab
- Page 320 and 321:
Immunogenetics and Life-Span 343Tab
- Page 322 and 323:
Immunogenetics and Life-Span 345Tab
- Page 324 and 325:
Immunogenetics and Life-Span 347Tab
- Page 326 and 327:
Immunogenetics and Life-Span 349to
- Page 328 and 329:
354 Yuto-implement intervention and
- Page 330 and 331:
356 Yuof their quality control proc
- Page 332 and 333:
358 Yugenesis of major diseases (1-
- Page 334 and 335:
Genetically Engineered Mice 36126Th
- Page 336 and 337:
Genetically Engineered Mice 363as t
- Page 338 and 339:
Genetically Engineered Mice 365in b
- Page 340 and 341:
Genetically Engineered Mice 367numb
- Page 342 and 343:
Genetically Engineered Mice 369mula
- Page 344 and 345:
Genetically Engineered Mice 371Othe
- Page 346 and 347:
Genetically Engineered Mice 373locu
- Page 348 and 349:
Genetically Engineered Mice 37537.
- Page 350:
Genetically Engineered Mice 377→