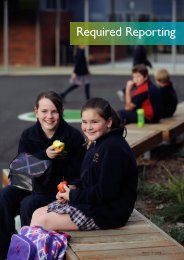
Department of Education
DoE Annual Report 2010-2011 - Department of Education
DoE Annual Report 2010-2011 - Department of Education
- No tags were found...

Create successful ePaper yourself
Turn your PDF publications into a flip-book with our unique Google optimized e-Paper software.
Corporate Services<br />
Performance measure 2008–09 2009–10 2010–11<br />
Unplanned staff absences 2.8% 3.0% 2.8%<br />
Separation rates for staff aged under 55 years:<br />
Tasmanian State Service Award (TSSA) general 3.5% 1.5% 2.3%<br />
<strong>Education</strong> facility attendant 1.2% 1.5% 0.9%<br />
Teaching service 1.2% 0.6% 0.7%<br />
Teacher aide 1.5% 1.1% 1.3%<br />
TSSA pr<strong>of</strong>essional 4.0% 4 3.8% 2.6%<br />
Allied health 6.0% 4 3.6% 4.3%<br />
SES 4.6%<br />
Average 1.8% 1.0% 1.1%<br />
Access to internet-connected computers in classrooms (number <strong>of</strong> students<br />
per computer):<br />
Primary schools 3.8 3.5 3.2<br />
Secondary schools 2.6 2.2 1.5<br />
Combined schools 2.7 2.3 2.2<br />
Colleges 4.7 3.3 2.6<br />
Special schools 4.0 3.9 2.4<br />
Government expenditure ($) per student (FTE) in government schools 5 13,258 6 N/A 7 N/A 8<br />
1 Due to the implementation <strong>of</strong> the Tasmanian Academy and the Tasmanian Polytechnic in 2009, colleges who were previously included in the<br />
Parent Opinion Survey were omitted from the 2009 and 2010 data collection.<br />
2 As secondary school students are not organised into single classes which exclusively undertake a complete education program, the department<br />
has adopted English class size as a proxy measure.<br />
3 This index is the slope measuring the effect <strong>of</strong> socioeconomic status on literacy and numeracy scores. A smaller value denotes greater equity.<br />
Reference values are related to national data from NAPLAN, and to data from PISA, an international education project.<br />
4 Allied health employees (social workers and speech pathologists) were included in the pr<strong>of</strong>essional category in previous years. Due to the TSSA,<br />
they are now reported separately. TSSA pr<strong>of</strong>essional includes librarians, curators and archivists.<br />
5 Includes notional user cost <strong>of</strong> capital and payroll tax. Excludes capital investing cost.<br />
6 Productivity Commission, Report on Government Services 2011, Table 4A.8.<br />
7 <strong>Department</strong> <strong>of</strong> <strong>Education</strong> interim figure, unpublished data.<br />
8 This figure was unavailable at the time <strong>of</strong> publication.<br />
Appendices – Additional Performance Measures<br />
133