France
France-HiT
France-HiT
Create successful ePaper yourself
Turn your PDF publications into a flip-book with our unique Google optimized e-Paper software.
xvi<br />
Health systems in transition <br />
<strong>France</strong><br />
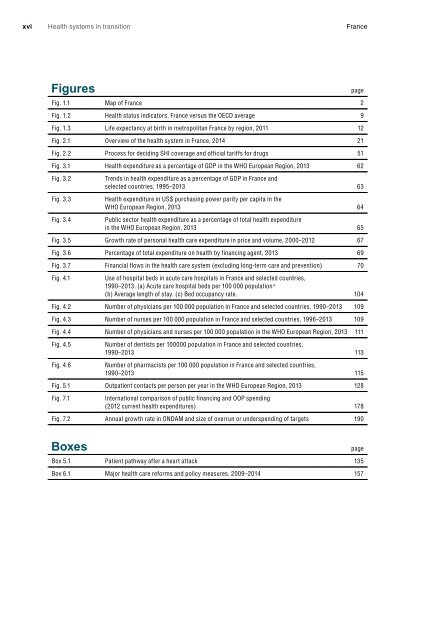
Figures page<br />
Fig. 1.1 Map of <strong>France</strong> 2<br />
Fig. 1.2 Health status indicators, <strong>France</strong> versus the OECD average 9<br />
Fig. 1.3 Life expectancy at birth in metropolitan <strong>France</strong> by region, 2011 12<br />
Fig. 2.1 Overview of the health system in <strong>France</strong>, 2014 21<br />
Fig. 2.2 Process for deciding SHI coverage and official tariffs for drugs 51<br />
Fig. 3.1 Health expenditure as a percentage of GDP in the WHO European Region, 2013 62<br />
Fig. 3.2<br />
Fig. 3.3<br />
Fig. 3.4<br />
Trends in health expenditure as a percentage of GDP in <strong>France</strong> and<br />
selected countries, 1995–2013 63<br />
Health expenditure in US$ purchasing power parity per capita in the<br />
WHO European Region, 2013 64<br />
Public sector health expenditure as a percentage of total health expenditure<br />
in the WHO European Region, 2013 65<br />
Fig. 3.5 Growth rate of personal health care expenditure in price and volume, 2000–2012 67<br />
Fig. 3.6 Percentage of total expenditure on health by financing agent, 2013 69<br />
Fig. 3.7 Financial flows in the health care system (excluding long-term care and prevention) 70<br />
Fig. 4.1<br />
Use of hospital beds in acute care hospitals in <strong>France</strong> and selected countries,<br />
1990–2013. (a) Acute care hospital beds per 100 000 population a<br />
(b) Average length of stay. (c) Bed occupancy rate. 104<br />
Fig. 4.2 Number of physicians per 100 000 population in <strong>France</strong> and selected countries, 1990–2013 109<br />
Fig. 4.3 Number of nurses per 100 000 population in <strong>France</strong> and selected countries, 1996–2013 109<br />
Fig. 4.4 Number of physicians and nurses per 100 000 population in the WHO European Region, 2013 111<br />
Fig. 4.5<br />
Fig. 4.6<br />
Number of dentists per 100000 population in <strong>France</strong> and selected countries,<br />
1990–2013 113<br />
Number of pharmacists per 100 000 population in <strong>France</strong> and selected countries,<br />
1990–2013 115<br />
Fig. 5.1 Outpatient contacts per person per year in the WHO European Region, 2013 128<br />
Fig. 7.1<br />
International comparison of public financing and OOP spending<br />
(2012 current health expenditures) 178<br />
Fig. 7.2 Annual growth rate in ONDAM and size of overrun or underspending of targets 190<br />
Boxes page<br />
Box 5.1 Patient pathway after a heart attack 135<br />
Box 6.1 Major health care reforms and policy measures, 2009–2014 157


