

France
France-HiT
France-HiT

You also want an ePaper? Increase the reach of your titles
YUMPU automatically turns print PDFs into web optimized ePapers that Google loves.
Health systems in transition <strong>France</strong> 9<br />
(63 for men and 64 for women in <strong>France</strong> and 61.4 for men 61.5 for women in<br />
the EU28) and at age 65 (9.8 for men and 10.7 for women in <strong>France</strong> and. 8.5 for<br />
men and 8.6 for women in the EU28) (Eurostat, 2015).<br />
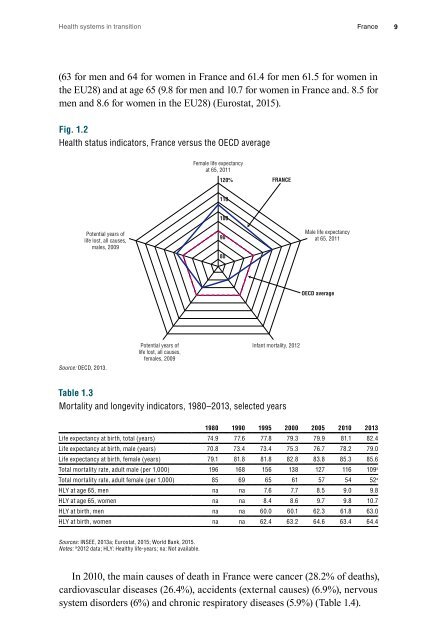
Fig. 1.2<br />
Health status indicators, <strong>France</strong> versus the OECD average<br />
Female life expectancy<br />
at 65, 2011<br />
120% FRANCE<br />
110<br />
100<br />
Potential years of<br />
life lost, all causes,<br />
males, 2009<br />
90<br />
80<br />
Male life expectancy<br />
at 65, 2011<br />
OECD average<br />
Source: OECD, 2013.<br />
Potential years of<br />
life lost, all causes,<br />
females, 2009<br />
Infant mortality, 2012<br />
Table 1.3<br />
Mortality and longevity indicators, 1980–2013, selected years<br />
1980 1990 1995 2000 2005 2010 2013<br />
Life expectancy at birth, total (years) 74.9 77.6 77.8 79.3 79.9 81.1 82.4<br />
Life expectancy at birth, male (years) 70.8 73.4 73.4 75.3 76.7 78.2 79.0<br />
Life expectancy at birth, female (years) 79.1 81.8 81.8 82.8 83.8 85.3 85.6<br />
Total mortality rate, adult male (per 1,000) 196 168 156 138 127 116 109 a<br />
Total mortality rate, adult female (per 1,000) 85 69 65 61 57 54 52 a<br />
HLY at age 65, men na na 7.6 7.7 8.5 9.0 9.8<br />
HLY at age 65, women na na 8.4 8.6 9.7 9.8 10.7<br />
HLY at birth, men na na 60.0 60.1 62.3 61.8 63.0<br />
HLY at birth, women na na 62.4 63.2 64.6 63.4 64.4<br />
Sources: INSEE, 2013a; Eurostat, 2015; World Bank, 2015.<br />
Notes: a 2012 data; HLY: Healthy life-years; na: Not available.<br />
In 2010, the main causes of death in <strong>France</strong> were cancer (28.2% of deaths),<br />
cardiovascular diseases (26.4%), accidents (external causes) (6.9%), nervous<br />
system disorders (6%) and chronic respiratory diseases (5.9%) (Table 1.4).