

France
France-HiT
France-HiT

Create successful ePaper yourself
Turn your PDF publications into a flip-book with our unique Google optimized e-Paper software.
178<br />
Health systems in transition <br />
<strong>France</strong><br />
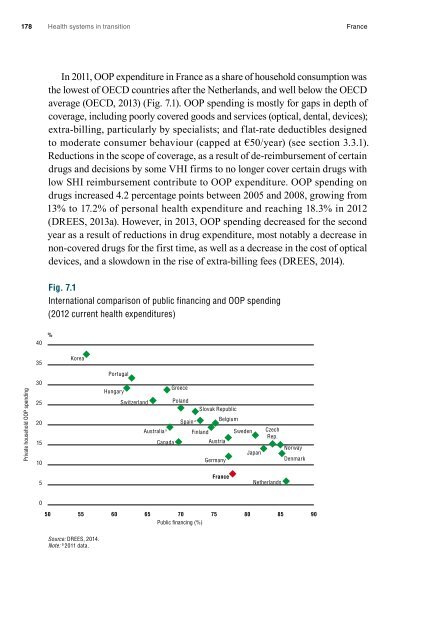
In 2011, OOP expenditure in <strong>France</strong> as a share of household consumption was<br />
the lowest of OECD countries after the Netherlands, and well below the OECD<br />
average (OECD, 2013) (Fig. 7.1). OOP spending is mostly for gaps in depth of<br />
coverage, including poorly covered goods and services (optical, dental, devices);<br />
extra-billing, particularly by specialists; and flat-rate deductibles designed<br />
to moderate consumer behaviour (capped at €50/year) (see section 3.3.1).<br />
Reductions in the scope of coverage, as a result of de-reimbursement of certain<br />
drugs and decisions by some VHI firms to no longer cover certain drugs with<br />
low SHI reimbursement contribute to OOP expenditure. OOP spending on<br />
drugs increased 4.2 percentage points between 2005 and 2008, growing from<br />
13% to 17.2% of personal health expenditure and reaching 18.3% in 2012<br />
(DREES, 2013a). However, in 2013, OOP spending decreased for the second<br />
year as a result of reductions in drug expenditure, most notably a decrease in<br />
non-covered drugs for the first time, as well as a decrease in the cost of optical<br />
devices, and a slowdown in the rise of extra-billing fees (DREES, 2014).<br />
Fig. 7.1<br />
International comparison of public financing and OOP spending<br />
(2012 current health expenditures)<br />
40<br />
%<br />
35<br />
Korea<br />
Portugal<br />
Private household OOP spending<br />
30<br />
25<br />
20<br />
15<br />
10<br />
Hungary<br />
Switzerland<br />
Greece<br />
Poland<br />
Slovak Republic<br />
Spain a Belgium<br />
Australia a<br />
Finland Sweden<br />
Canada<br />
Austria<br />
Japan<br />
Germany<br />
Czech<br />
Rep.<br />
Norway<br />
Denmark<br />
5<br />
<strong>France</strong><br />
Netherlands<br />
0<br />
50<br />
55<br />
60<br />
65<br />
70<br />
75<br />
80<br />
85<br />
90<br />
Public financing (%)<br />
Source: DREES, 2014.<br />
Note: a 2011 data.