- Page 1:
Ecological Key Editors E Christophe
- Page 4 and 5:
First edition © 2011 Gaia Educatio
- Page 6 and 7:
iv 2 Local Food Healthy Soil Restor
- Page 8 and 9:
vi The Editors In the midst of a sp
- Page 10 and 11:
viii Designing ecological Habitats
- Page 12 and 13:
x Designing ecological Habitats are
- Page 14 and 15:
World-renowned ecovillage designer
- Page 16 and 17:
4 Designing ecological Habitats and
- Page 18 and 19:
6 Designing ecological Habitats One
- Page 20 and 21:
This Introduction section provides
- Page 22 and 23:
10 Designing ecological Habitats vo
- Page 24 and 25:
12 Designing ecological Habitats 1.
- Page 26 and 27:
Albert Bates, founder of the Ecovil
- Page 28 and 29:
16 Designing ecological Habitats At
- Page 30 and 31:
18 Designing ecological Habitats fe
- Page 32 and 33:
20 Designing ecological Habitats Th
- Page 34 and 35:
22 Designing ecological Habitats No
- Page 36 and 37:
24 Designing ecological Habitats P
- Page 38 and 39:
26 Designing ecological Habitats Ta
- Page 40 and 41:
28 Designing ecological Habitats Sv
- Page 42 and 43:
30 Designing ecological Habitats Mu
- Page 44 and 45:
With the inclusion of Declan Kenned
- Page 46 and 47:
34 Designing ecological Habitats Ve
- Page 48 and 49:
36 Designing ecological Habitats De
- Page 50 and 51:
38 Designing ecological Habitats of
- Page 52 and 53:
40 Designing ecological Habitats of
- Page 54 and 55:
42 Designing ecological Habitats Fi
- Page 56 and 57:
44 Designing ecological Habitats Fi
- Page 58 and 59:
46 Designing ecological Habitats Sc
- Page 60 and 61:
48 Designing ecological Habitats of
- Page 62 and 63:
50 Designing ecological Habitats It
- Page 64 and 65:
52 Designing ecological Habitats 7
- Page 66 and 67:
Dr. Matthew Hardy introduces Module
- Page 68 and 69:
56 Designing ecological Habitats tr
- Page 70 and 71:
58 Designing ecological Habitats Ma
- Page 72 and 73:
60 Designing ecological Habitats Re
- Page 74 and 75:
Cordelia Osasona provides a captiva
- Page 76 and 77:
64 Designing ecological Habitats Mo
- Page 78 and 79:
66 Designing ecological Habitats Cl
- Page 80 and 81:
68 Designing ecological Habitats in
- Page 82 and 83:
70 Designing ecological Habitats Wo
- Page 84 and 85:
72 Designing ecological Habitats
- Page 86 and 87:
74 Designing ecological Habitats
- Page 88 and 89:
76 Designing ecological Habitats Th
- Page 90 and 91:
78 Designing ecological Habitats me
- Page 92 and 93:
Roshni Udyavar takes us to India wi
- Page 94 and 95:
82 Designing ecological Habitats Ri
- Page 96 and 97:
84 Designing ecological Habitats Ea
- Page 98 and 99:
Elke Cole knows what it takes to bu
- Page 100 and 101:
88 Designing ecological Habitats Wh
- Page 102 and 103:
Accomplished author, seasoned build
- Page 104 and 105:
92 Designing ecological Habitats Th
- Page 106 and 107:
94 Designing ecological Habitats Ea
- Page 108 and 109:
96 Designing ecological Habitats Wh
- Page 110 and 111:
98 Designing ecological Habitats A
- Page 112 and 113:
This article on soil restoration be
- Page 114 and 115:
102 Designing ecological Habitats L
- Page 116 and 117:
104 Designing ecological Habitats f
- Page 118 and 119:
106 Designing ecological Habitats T
- Page 120 and 121:
108 Designing ecological Habitats T
- Page 122 and 123:
110 Designing ecological Habitats A
- Page 124 and 125:
This article traces the history of
- Page 126 and 127:
114 Designing ecological Habitats h
- Page 128 and 129:
116 Designing ecological Habitats B
- Page 130 and 131:
EcoVillage at Ithaca (EVI) has beco
- Page 132 and 133:
120 Designing ecological Habitats W
- Page 134 and 135:
122 Designing ecological Habitats M
- Page 136 and 137:
For permaculture connoisseur Maddy
- Page 138 and 139:
126 Designing ecological Habitats e
- Page 140 and 141:
128 Designing ecological Habitats T
- Page 142 and 143: 130 Designing ecological Habitats E
- Page 144 and 145: 132 Designing ecological Habitats N
- Page 146 and 147: 134 Designing ecological Habitats g
- Page 148 and 149: Suzanne Foote describes in moving e
- Page 150 and 151: 138 Designing ecological Habitats S
- Page 152 and 153: 140 Designing ecological Habitats C
- Page 154 and 155: This lead article for Module 3 was
- Page 156 and 157: 144 Designing ecological Habitats I
- Page 158 and 159: John Vermeulen and Kevin Velasco, f
- Page 160 and 161: 148 Designing ecological Habitats I
- Page 162 and 163: 150 Designing ecological Habitats A
- Page 164 and 165: Existing conversations about approp
- Page 166 and 167: 154 Designing ecological Habitats D
- Page 168 and 169: 156 Designing ecological Habitats e
- Page 170 and 171: There are many ways to approach Mod
- Page 172 and 173: 160 Designing ecological Habitats S
- Page 174 and 175: 162 Designing ecological Habitats w
- Page 176 and 177: 164 Designing ecological Habitats i
- Page 178 and 179: 166 Designing ecological Habitats d
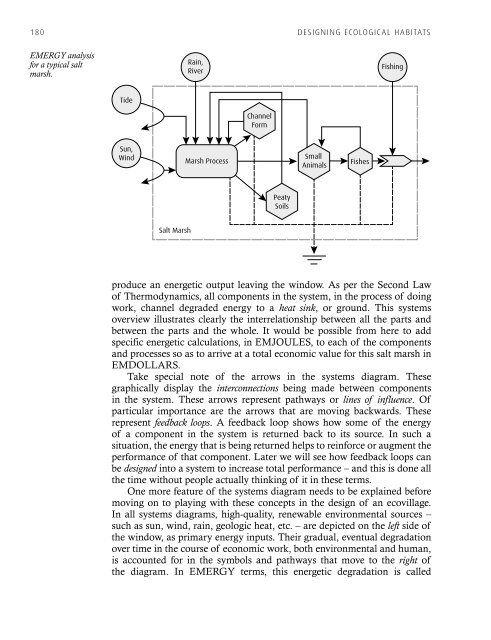
- Page 180 and 181: 168 Designing ecological Habitats A
- Page 182 and 183: 170 Designing ecological Habitats e
- Page 184 and 185: 172 Designing ecological Habitats T
- Page 186 and 187: 174 Designing ecological Habitats T
- Page 188 and 189: 176 Designing ecological Habitats S
- Page 190 and 191: 178 Designing ecological Habitats b
- Page 194 and 195: 182 Designing ecological Habitats S
- Page 196 and 197: 184 Designing ecological Habitats 3
- Page 199 and 200: MODuLE 4 Restoring Nature Contents
- Page 201 and 202: Designing witH Deep respect: Deep e
- Page 203 and 204: Designing witH Deep respect: Deep e
- Page 205 and 206: Designing witH Deep respect: Deep e
- Page 207 and 208: environmental restoration in aurovi
- Page 209 and 210: environmental restoration in aurovi
- Page 211 and 212: Introduction Sajini Pathiraja, from
- Page 213 and 214: Damniyamgama eco-village : sustaina
- Page 215 and 216: Damniyamgama eco-village : sustaina
- Page 217 and 218: Damniyamgama eco-village : sustaina
- Page 219 and 220: trees, water anD people : rebuilDin
- Page 221 and 222: trees, water anD people : rebuilDin
- Page 223 and 224: trees, water anD people : rebuilDin
- Page 225 and 226: Impact, Recovery & Conservation of
- Page 227 and 228: impact, recovery anD conservation o
- Page 229 and 230: impact, recovery anD conservation o
- Page 231 and 232: Incorporating Earth Energy into the
- Page 233 and 234: incorporating eartH energy into tHe
- Page 235 and 236: incorporating eartH energy into tHe
- Page 237 and 238: incorporating eartH energy into tHe
- Page 239 and 240: Body as Place: A Somatic Guide to R
- Page 241 and 242: oDy as place : a somatic guiDe to r
- Page 243 and 244:
oDy as place : a somatic guiDe to r
- Page 245 and 246:
MODuLE 5 Integrated Ecological Desi
- Page 247 and 248:
tHe etHics anD principles of permac
- Page 249 and 250:
tHe etHics anD principles of permac
- Page 251 and 252:
tHe etHics anD principles of permac
- Page 253 and 254:
integral ecology: Design principles
- Page 255 and 256:
integral ecology: Design principles
- Page 257 and 258:
integral ecology: Design principles
- Page 259 and 260:
integral ecology: Design principles
- Page 261 and 262:
integral ecology: Design principles
- Page 263 and 264:
macro to micro: introDucing ecosoci
- Page 265 and 266:
macro to micro: introDucing ecosoci
- Page 267 and 268:
macro to micro: introDucing ecosoci
- Page 269 and 270:
macro to micro: introDucing ecosoci
- Page 271 and 272:
agroecology anD ecovillages 259 Thi
- Page 273 and 274:
agroecology anD ecovillages 261 it
- Page 275 and 276:
World-renowned speaker and entrepre
- Page 277 and 278:
Design witH tHe flow 265 Imagine th
- Page 279 and 280:
Design witH tHe flow 267 Some of th
- Page 281 and 282:
a Design framework 269 characterist
- Page 283 and 284:
a Design framework 271 climatic fac
- Page 285 and 286:
During a recent study called ‘Con
- Page 287 and 288:
“ecology of consciousness” 275
- Page 289 and 290:
“ecology of consciousness” 277
- Page 292:
Gaia education Designing Ecological