Human Development Report 2016
6Tyccfrzw
6Tyccfrzw

You also want an ePaper? Increase the reach of your titles
YUMPU automatically turns print PDFs into web optimized ePapers that Google loves.
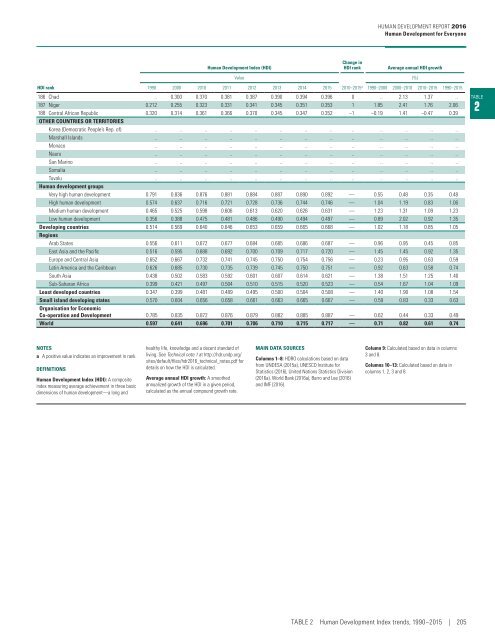
HUMAN DEVELOPMENT REPORT <strong>2016</strong><br />
<strong>Human</strong> <strong>Development</strong> for Everyone<br />
<strong>Human</strong> <strong>Development</strong> Index (HDI)<br />
Change in<br />
HDI rank<br />
Average annual HDI growth<br />
Value (%)<br />
HDI rank 1990 2000 2010 2011 2012 2013 2014 2015 2010–2015 a 1990–2000 2000–2010 2010–2015 1990–2015<br />
186 Chad .. 0.300 0.370 0.381 0.387 0.390 0.394 0.396 0 .. 2.13 1.37 ..<br />
187 Niger 0.212 0.255 0.323 0.331 0.341 0.345 0.351 0.353 1 1.85 2.41 1.76 2.06<br />
188 Central African Republic 0.320 0.314 0.361 0.366 0.370 0.345 0.347 0.352 –1 –0.19 1.41 –0.47 0.39<br />
OTHER COUNTRIES OR TERRITORIES<br />
Korea (Democratic People’s Rep. of) .. .. .. .. .. .. .. .. .. .. .. .. ..<br />
Marshall Islands .. .. .. .. .. .. .. .. .. .. .. .. ..<br />
Monaco .. .. .. .. .. .. .. .. .. .. .. .. ..<br />
Nauru .. .. .. .. .. .. .. .. .. .. .. .. ..<br />
San Marino .. .. .. .. .. .. .. .. .. .. .. .. ..<br />
Somalia .. .. .. .. .. .. .. .. .. .. .. .. ..<br />
Tuvalu .. .. .. .. .. .. .. .. .. .. .. .. ..<br />
<strong>Human</strong> development groups<br />
Very high human development 0.791 0.836 0.876 0.881 0.884 0.887 0.890 0.892 — 0.55 0.48 0.35 0.48<br />
High human development 0.574 0.637 0.716 0.721 0.728 0.736 0.744 0.746 — 1.04 1.19 0.83 1.06<br />
Medium human development 0.465 0.525 0.598 0.606 0.613 0.620 0.626 0.631 — 1.23 1.31 1.09 1.23<br />
Low human development 0.356 0.388 0.475 0.481 0.486 0.490 0.494 0.497 — 0.89 2.02 0.92 1.35<br />
Developing countries 0.514 0.569 0.640 0.646 0.653 0.659 0.665 0.668 — 1.02 1.18 0.85 1.05<br />
Regions<br />
Arab States 0.556 0.611 0.672 0.677 0.684 0.685 0.686 0.687 — 0.96 0.95 0.45 0.85<br />
East Asia and the Pacific 0.516 0.595 0.688 0.692 0.700 0.709 0.717 0.720 — 1.45 1.45 0.92 1.35<br />
Europe and Central Asia 0.652 0.667 0.732 0.741 0.745 0.750 0.754 0.756 — 0.23 0.95 0.63 0.59<br />
Latin America and the Caribbean 0.626 0.685 0.730 0.735 0.739 0.745 0.750 0.751 — 0.92 0.63 0.58 0.74<br />
South Asia 0.438 0.502 0.583 0.592 0.601 0.607 0.614 0.621 — 1.38 1.51 1.25 1.40<br />
Sub-Saharan Africa 0.399 0.421 0.497 0.504 0.510 0.515 0.520 0.523 — 0.54 1.67 1.04 1.09<br />
Least developed countries 0.347 0.399 0.481 0.489 0.495 0.500 0.504 0.508 — 1.40 1.90 1.08 1.54<br />
Small island developing states 0.570 0.604 0.656 0.658 0.661 0.663 0.665 0.667 — 0.59 0.83 0.33 0.63<br />
Organisation for Economic<br />
Co‐operation and <strong>Development</strong> 0.785 0.835 0.872 0.876 0.879 0.882 0.885 0.887 — 0.62 0.44 0.33 0.49<br />
World 0.597 0.641 0.696 0.701 0.706 0.710 0.715 0.717 — 0.71 0.82 0.61 0.74<br />
TABLE<br />
2<br />
NOTES<br />
a A positive value indicates an improvement in rank.<br />
DEFINITIONS<br />
<strong>Human</strong> <strong>Development</strong> Index (HDI): A composite<br />
index measuring average achievement in three basic<br />
dimensions of human development — a long and<br />
healthy life, knowledge and a decent standard of<br />
living. See Technical note 1 at http://hdr.undp.org/<br />
sites/default/files/hdr<strong>2016</strong>_technical_notes.pdf for<br />
details on how the HDI is calculated.<br />
Average annual HDI growth: A smoothed<br />
annualized growth of the HDI in a given period,<br />
calculated as the annual compound growth rate.<br />
MAIN DATA SOURCES<br />
Columns 1–8: HDRO calculations based on data<br />
from UNDESA (2015a), UNESCO Institute for<br />
Statistics (<strong>2016</strong>), United Nations Statistics Division<br />
(<strong>2016</strong>a), World Bank (<strong>2016</strong>a), Barro and Lee (<strong>2016</strong>)<br />
and IMF (<strong>2016</strong>).<br />
Column 9: Calculated based on data in columns<br />
3 and 8.<br />
Columns 10–13: Calculated based on data in<br />
columns 1, 2, 3 and 8.<br />
TABLE 2 <strong>Human</strong> <strong>Development</strong> Index trends, 1990–2015 | 205