Human Development Report 2016
6Tyccfrzw
6Tyccfrzw

You also want an ePaper? Increase the reach of your titles
YUMPU automatically turns print PDFs into web optimized ePapers that Google loves.
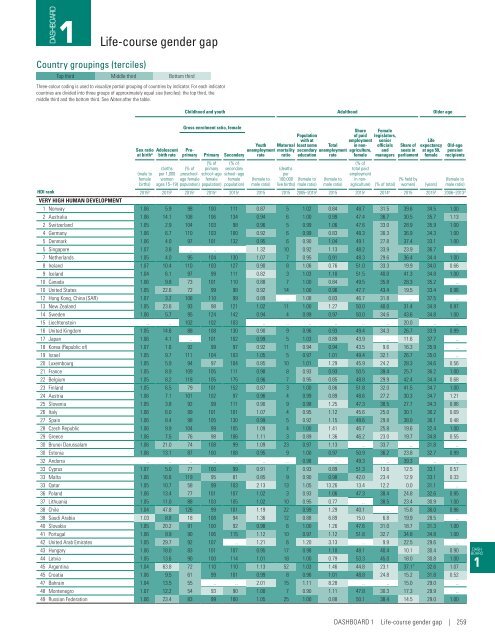
DASHBOARD<br />
1<br />
Life-course gender gap<br />
Country groupings (terciles)<br />
Top third Middle third Bottom third<br />
Three-colour coding is used to visualize partial grouping of countries by indicator. For each indicator<br />
countries are divided into three groups of approximately equal size (terciles): the top third, the<br />
middle third and the bottom third. See Notes after the table.<br />
Childhood and youth Adulthood Older age<br />
Sex ratio Adolescent<br />
at birth a birth rate<br />
(male to<br />
female<br />
births)<br />
(births<br />
per 1,000<br />
women<br />
ages 15–19)<br />
Gross enrolment ratio, female<br />
Preprimary<br />
Primary Secondary<br />
(% of<br />
preschoolage<br />
female<br />
population)<br />
(% of<br />
primary<br />
school–age<br />
female<br />
population)<br />
(% of<br />
secondary<br />
school–age<br />
female<br />
population)<br />
Youth<br />
unemployment<br />
rate<br />
(female to<br />
male ratio)<br />
HDI rank<br />
2015 b 2015 b 2015 c 2015 c 2015 c 2015 2015 2005–2015 d 2015 2015 c 2014 e 2015 2015 b 2006–2013 d<br />
VERY HIGH HUMAN DEVELOPMENT<br />
1 Norway 1.06 5.9 98 100 111 0.87 5 1.02 0.84 48.7 31.5 39.6 34.5 1.00<br />
2 Australia 1.06 14.1 108 106 134 0.94 6 1.00 0.99 47.4 36.7 30.5 35.7 1.13<br />
2 Switzerland 1.05 2.9 104 103 98 0.96 5 0.99 1.06 47.6 33.0 28.9 35.9 1.00<br />
4 Germany 1.06 6.7 110 103 100 0.92 6 0.99 0.83 48.3 30.3 36.9 34.3 1.00<br />
5 Denmark 1.06 4.0 97 101 132 0.95 6 0.90 1.04 49.1 27.8 37.4 33.1 1.00<br />
5 Singapore 1.07 3.8 .. .. .. 1.32 10 0.92 1.13 48.2 33.9 23.9 36.7 ..<br />
7 Netherlands 1.05 4.0 95 104 130 1.07 7 0.95 0.91 48.3 29.6 36.4 34.4 1.00<br />
8 Ireland 1.07 10.4 110 103 127 0.90 8 1.06 0.76 51.0 33.3 19.9 34.0 0.66<br />
9 Iceland 1.04 6.1 97 99 111 0.82 3 1.03 1.10 51.5 40.0 41.3 34.8 1.00<br />
10 Canada 1.06 9.8 73 101 110 0.88 7 1.00 0.84 49.5 35.8 28.3 35.2 ..<br />
10 United States 1.05 22.6 72 99 98 0.92 14 1.00 0.96 47.7 43.4 19.5 33.4 0.96<br />
12 Hong Kong, China (SAR) 1.07 3.2 108 110 99 0.89 .. 1.08 0.83 46.7 31.8 .. 37.5 ..<br />
13 New Zealand 1.05 23.6 93 98 121 1.02 11 1.00 1.27 50.0 40.0 31.4 34.9 0.97<br />
14 Sweden 1.06 5.7 95 124 142 0.94 4 0.99 0.97 50.0 34.6 43.6 34.8 1.00<br />
15 Liechtenstein .. .. 102 102 103 .. .. .. .. .. .. 20.0 .. ..<br />
16 United Kingdom 1.05 14.6 88 108 130 0.90 9 0.96 0.93 49.4 34.3 26.7 33.9 0.99<br />
17 Japan 1.06 4.1 .. 101 102 0.99 5 1.03 0.89 43.9 .. 11.6 37.7 ..<br />
18 Korea (Republic of) 1.07 1.6 92 99 97 0.92 11 0.94 0.94 43.5 9.6 16.3 35.9 ..<br />
19 Israel 1.05 9.7 111 104 103 1.05 5 0.97 1.01 49.4 32.1 26.7 35.0 ..<br />
20 Luxembourg 1.05 5.9 94 97 104 0.85 10 1.01 1.29 45.9 24.2 28.3 34.6 0.56<br />
21 France 1.05 8.9 109 105 111 0.98 8 0.93 0.93 50.5 39.4 25.7 36.2 1.00<br />
22 Belgium 1.05 8.2 118 105 175 0.96 7 0.95 0.85 48.8 29.9 42.4 34.4 0.68<br />
23 Finland 1.05 6.5 79 101 152 0.87 3 1.00 0.86 51.8 32.0 41.5 34.7 1.00<br />
24 Austria 1.06 7.1 101 102 97 0.96 4 0.99 0.89 48.6 27.2 30.3 34.7 1.21<br />
25 Slovenia 1.05 3.8 92 99 111 0.90 9 0.98 1.25 47.3 38.5 27.7 34.3 0.86<br />
26 Italy 1.06 6.0 99 101 101 1.07 4 0.95 1.12 45.6 25.0 30.1 36.2 0.69<br />
27 Spain 1.06 8.4 98 105 130 0.99 5 0.92 1.15 48.6 29.8 38.0 36.1 0.48<br />
28 Czech Republic 1.06 9.9 104 99 105 1.09 4 1.00 1.41 46.7 25.8 19.6 32.4 1.00<br />
29 Greece 1.06 7.5 76 98 106 1.11 3 0.89 1.36 46.2 23.0 19.7 34.8 0.55<br />
30 Brunei Darussalam 1.06 21.0 74 108 99 1.09 23 0.97 1.13 .. 33.7 .. 31.8 ..<br />
30 Estonia 1.06 13.1 87 100 108 0.95 9 1.00 0.97 50.9 36.2 23.8 32.7 0.99<br />
32 Andorra .. .. .. .. .. .. .. 0.98 .. 49.3 .. 39.3 .. ..<br />
33 Cyprus 1.07 5.0 77 100 99 0.91 7 0.93 0.89 51.3 13.6 12.5 33.1 0.57<br />
33 Malta 1.06 16.6 119 95 81 0.85 9 0.90 0.98 42.0 23.4 12.9 33.1 0.33<br />
33 Qatar 1.05 10.7 58 99 103 2.13 13 1.05 13.26 13.4 12.2 0.0 31.1 ..<br />
36 Poland 1.06 13.4 77 101 107 1.02 3 0.93 1.06 47.3 38.4 24.8 32.6 0.95<br />
37 Lithuania 1.05 11.0 88 103 105 1.02 10 0.95 0.77 .. 38.5 23.4 30.9 1.00<br />
38 Chile 1.04 47.8 126 99 101 1.19 22 0.99 1.29 40.1 .. 15.8 36.0 0.96<br />
38 Saudi Arabia 1.03 8.8 18 108 94 1.36 12 0.88 6.89 15.0 6.8 19.9 28.5 ..<br />
40 Slovakia 1.05 20.2 91 100 92 0.98 6 1.00 1.26 47.6 31.0 18.7 31.3 1.00<br />
41 Portugal 1.06 9.9 90 106 115 1.12 10 0.97 1.12 51.8 32.7 34.8 34.8 1.00<br />
42 United Arab Emirates 1.05 29.7 92 107 .. 1.21 6 1.20 3.13 .. 9.9 22.5 29.6 ..<br />
43 Hungary 1.06 18.0 83 101 107 0.95 17 0.98 1.10 48.1 40.4 10.1 30.4 0.90<br />
44 Latvia 1.05 13.6 90 100 114 1.01 18 1.00 0.79 53.3 45.0 18.0 30.8 1.00<br />
45 Argentina 1.04 63.8 72 110 110 1.13 52 1.03 1.46 44.8 23.1 37.1 f 32.6 1.07<br />
45 Croatia 1.06 9.5 61 99 101 0.99 8 0.96 1.01 48.8 24.8 15.2 31.8 0.52<br />
47 Bahrain 1.04 13.5 55 .. .. 2.01 15 1.11 8.28 .. .. 15.0 29.0 ..<br />
48 Montenegro 1.07 12.2 54 93 90 1.00 7 0.90 1.11 47.8 30.3 17.3 29.9 ..<br />
49 Russian Federation 1.06 23.4 83 99 100 1.05 25 1.00 0.88 50.1 38.4 14.5 29.0 1.00<br />
Maternal<br />
mortality<br />
ratio<br />
Population<br />
with at<br />
least some<br />
secondary<br />
education<br />
(deaths<br />
per<br />
100,000 (female to<br />
live births) male ratio)<br />
Total<br />
unemployment<br />
rate<br />
(female to<br />
male ratio)<br />
Share<br />
of paid<br />
employment<br />
in nonagriculture,<br />
female<br />
(% of<br />
total paid<br />
employment<br />
in nonagriculture)<br />
Female<br />
legislators,<br />
senior<br />
officials<br />
and<br />
managers<br />
(% of total)<br />
Share of<br />
seats in<br />
parliament<br />
(% held by<br />
women)<br />
Life<br />
expectancy<br />
at age 50,<br />
female<br />
(years)<br />
Old-age<br />
pension<br />
recipients<br />
(female to<br />
male ratio)<br />
DASH<br />
BOARD<br />
1<br />
DASHBOARD 1 Life-course gender gap | 259