Human Development Report 2016
6Tyccfrzw
6Tyccfrzw

You also want an ePaper? Increase the reach of your titles
YUMPU automatically turns print PDFs into web optimized ePapers that Google loves.
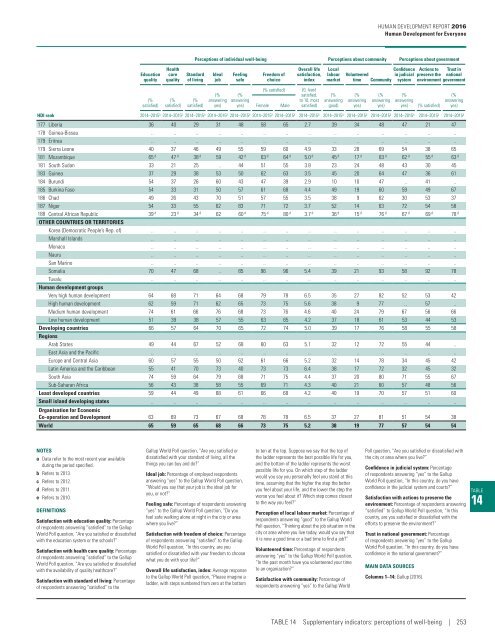
HUMAN DEVELOPMENT REPORT <strong>2016</strong><br />
<strong>Human</strong> <strong>Development</strong> for Everyone<br />
Perceptions of individual well-being Perceptions about community Perceptions about government<br />
Education<br />
quality<br />
(%<br />
satisfied)<br />
Health<br />
care<br />
quality<br />
(%<br />
satisfied)<br />
Standard<br />
of living<br />
(%<br />
satisfied)<br />
Ideal<br />
job<br />
(%<br />
answering<br />
yes)<br />
Feeling<br />
safe<br />
(%<br />
answering<br />
yes)<br />
Freedom of<br />
choice<br />
Overall life<br />
satisfaction,<br />
index<br />
(% satisfied) (0, least<br />
Female Male<br />
satisfied,<br />
to 10, most<br />
satisfied)<br />
Local<br />
labour<br />
market<br />
(%<br />
answering<br />
good)<br />
Volunteered<br />
Confidence Actions to<br />
in judicial preserve the<br />
Trust in<br />
national<br />
time Community system environment government<br />
(%<br />
answering<br />
yes)<br />
(%<br />
answering<br />
yes)<br />
(%<br />
answering<br />
yes)<br />
(% satisfied)<br />
(%<br />
answering<br />
yes)<br />
HDI rank 2014–2015 a 2014–2015 a 2014–2015 a 2014–2015 a 2014–2015 a 2014–2015 a 2014–2015 a 2014–2015 a 2014–2015 a 2014–2015 a 2014–2015 a 2014–2015 a 2014–2015 a 2014–2015 a<br />
177 Liberia 36 40 29 31 48 58 65 2.7 39 34 48 47 21 47<br />
178 Guinea-Bissau .. .. .. .. .. .. .. .. .. .. .. .. .. ..<br />
179 Eritrea .. .. .. .. .. .. .. .. .. .. .. .. .. ..<br />
179 Sierra Leone 40 37 46 49 55 59 60 4.9 33 28 69 54 38 65<br />
181 Mozambique 65 d 47 d 38 d 59 42 d 63 d 64 d 5.0 d 45 d 17 d 83 d 62 d 55 d 63 d<br />
181 South Sudan 33 21 25 .. 44 51 55 3.8 23 24 48 43 30 45<br />
183 Guinea 37 29 38 53 50 62 63 3.5 45 20 64 47 36 61<br />
184 Burundi 54 37 26 60 43 47 39 2.9 10 10 47 .. 41 ..<br />
185 Burkina Faso 54 33 31 50 57 61 68 4.4 49 19 60 59 49 67<br />
186 Chad 49 26 43 70 51 57 55 3.5 38 9 62 30 53 37<br />
187 Niger 54 33 55 62 83 71 72 3.7 52 14 63 72 54 58<br />
188 Central African Republic 39 d 23 d 34 d 62 60 d 75 d 80 d 3.7 d 36 d 15 d 76 d 67 d 69 d 78 d<br />
OTHER COUNTRIES OR TERRITORIES<br />
Korea (Democratic People’s Rep. of) .. .. .. .. .. .. .. .. .. .. .. .. .. ..<br />
Marshall Islands .. .. .. .. .. .. .. .. .. .. .. .. .. ..<br />
Monaco .. .. .. .. .. .. .. .. .. .. .. .. .. ..<br />
Nauru .. .. .. .. .. .. .. .. .. .. .. .. .. ..<br />
San Marino .. .. .. .. .. .. .. .. .. .. .. .. .. ..<br />
Somalia 70 47 68 .. 85 96 96 5.4 39 21 93 58 92 78<br />
Tuvalu .. .. .. .. .. .. .. .. .. .. .. .. .. ..<br />
<strong>Human</strong> development groups<br />
Very high human development 64 68 71 64 68 79 78 6.5 35 27 82 52 53 42<br />
High human development 62 59 71 62 65 73 75 5.6 38 9 77 .. 57 ..<br />
Medium human development 74 61 66 76 68 73 76 4.6 40 24 79 67 56 66<br />
Low human development 51 39 38 57 55 63 65 4.2 37 18 61 53 44 53<br />
Developing countries 66 57 64 70 65 72 74 5.0 39 17 76 58 55 58<br />
Regions<br />
Arab States 49 44 67 52 68 60 63 5.1 32 12 72 55 44 ..<br />
East Asia and the Pacific .. .. .. .. .. .. .. .. .. .. .. .. .. ..<br />
Europe and Central Asia 60 57 55 50 62 61 66 5.2 32 14 78 34 45 42<br />
Latin America and the Caribbean 55 41 70 73 40 73 73 6.4 38 17 72 32 45 32<br />
South Asia 74 59 64 79 68 71 75 4.4 37 20 80 71 55 67<br />
Sub-Saharan Africa 56 43 38 58 55 69 71 4.3 40 21 60 57 48 56<br />
Least developed countries 59 44 49 68 61 66 68 4.2 40 19 70 57 51 60<br />
Small island developing states .. .. .. .. .. .. .. .. .. .. .. .. .. ..<br />
Organisation for Economic<br />
Co‐operation and <strong>Development</strong> 63 69 73 67 68 78 78 6.5 37 27 81 51 54 38<br />
World 65 59 65 68 66 73 75 5.2 38 19 77 57 54 54<br />
NOTES<br />
a Data refer to the most recent year available<br />
during the period specified.<br />
b Refers to 2013.<br />
c Refers to 2012.<br />
d Refers to 2011.<br />
e Refers to 2010.<br />
DEFINITIONS<br />
Satisfaction with education quality: Percentage<br />
of respondents answering “satisfied” to the Gallup<br />
World Poll question, “Are you satisfied or dissatisfied<br />
with the education system or the schools?”<br />
Satisfaction with health care quality: Percentage<br />
of respondents answering “satisfied” to the Gallup<br />
World Poll question, “Are you satisfied or dissatisfied<br />
with the availability of quality healthcare?”<br />
Satisfaction with standard of living: Percentage<br />
of respondents answering “satisfied” to the<br />
Gallup World Poll question, “Are you satisfied or<br />
dissatisfied with your standard of living, all the<br />
things you can buy and do?”<br />
Ideal job: Percentage of employed respondents<br />
answering “yes” to the Gallup World Poll question,<br />
“Would you say that your job is the ideal job for<br />
you, or not?”<br />
Feeling safe: Percentage of respondents answering<br />
“yes” to the Gallup World Poll question, “Do you<br />
feel safe walking alone at night in the city or area<br />
where you live?”<br />
Satisfaction with freedom of choice: Percentage<br />
of respondents answering “satisfied” to the Gallup<br />
World Poll question, “In this country, are you<br />
satisfied or dissatisfied with your freedom to choose<br />
what you do with your life?”<br />
Overall life satisfaction, index: Average response<br />
to the Gallup World Poll question, “Please imagine a<br />
ladder, with steps numbered from zero at the bottom<br />
to ten at the top. Suppose we say that the top of<br />
the ladder represents the best possible life for you,<br />
and the bottom of the ladder represents the worst<br />
possible life for you. On which step of the ladder<br />
would you say you personally feel you stand at this<br />
time, assuming that the higher the step the better<br />
you feel about your life, and the lower the step the<br />
worse you feel about it? Which step comes closest<br />
to the way you feel?”<br />
Perception of local labour market: Percentage of<br />
respondents answering “good” to the Gallup World<br />
Poll question, “Thinking about the job situation in the<br />
city or area where you live today, would you say that<br />
it is now a good time or a bad time to find a job?”<br />
Volunteered time: Percentage of respondents<br />
answering “yes” to the Gallup World Poll question,<br />
“In the past month have you volunteered your time<br />
to an organization?”<br />
Satisfaction with community: Percentage of<br />
respondents answering “yes” to the Gallup World<br />
Poll question, “Are you satisfied or dissatisfied with<br />
the city or area where you live?”<br />
Confidence in judicial system: Percentage<br />
of respondents answering “yes” to the Gallup<br />
World Poll question, “In this country, do you have<br />
confidence in the judicial system and courts?”<br />
Satisfaction with actions to preserve the<br />
environment: Percentage of respondents answering<br />
“satisfied” to Gallup World Poll question, “In this<br />
country, are you satisfied or dissatisfied with the<br />
efforts to preserve the environment?”<br />
Trust in national government: Percentage<br />
of respondents answering “yes” to the Gallup<br />
World Poll question, “In this country, do you have<br />
confidence in the national government?”<br />
MAIN DATA SOURCES<br />
Columns 1–14: Gallup (<strong>2016</strong>).<br />
TABLE<br />
14<br />
TABLE 14 Supplementary indicators: perceptions of well-being | 253