- Page 1:
CICS Transaction Gateway V5 The Web
- Page 4 and 5:
Note: Before using this information
- Page 6 and 7:
iv CICS Transaction Gateway V5 2.5
- Page 8 and 9:
vi CICS Transaction Gateway V5 9.4.
- Page 10 and 11:
viii CICS Transaction Gateway V5
- Page 12 and 13:
Trademarks IBM, the IBM logo, and i
- Page 14 and 15:
The team that wrote this redbook xi
- Page 16 and 17:
► Mail your comments to: xiv CICS
- Page 18 and 19:
xvi CICS Transaction Gateway V5
- Page 20 and 21:
2 CICS Transaction Gateway V5
- Page 22 and 23:
1.1 CICS TG: Infrastructure 4 CICS
- Page 24 and 25:
6 CICS Transaction Gateway V5 CCL80
- Page 26 and 27:
8 CICS Transaction Gateway V5 On z/
- Page 28 and 29: 1.1.4 Terminal Servlet 10 CICS Tran
- Page 30 and 31: 12 CICS Transaction Gateway V5 CICS
- Page 32 and 33: 14 CICS Transaction Gateway V5 Chan
- Page 34 and 35: 16 CICS Transaction Gateway V5
- Page 36 and 37: 2.1 Introduction to APPC 18 CICS Tr
- Page 38 and 39: 20 CICS Transaction Gateway V5 The
- Page 40 and 41: 22 CICS Transaction Gateway V5 SING
- Page 42 and 43: 24 CICS Transaction Gateway V5 Like
- Page 44 and 45: 26 CICS Transaction Gateway V5 If y
- Page 46 and 47: 28 CICS Transaction Gateway V5 MAXP
- Page 48 and 49: 30 CICS Transaction Gateway V5 Figu
- Page 50 and 51: 32 CICS Transaction Gateway V5 I CO
- Page 52 and 53: 34 CICS Transaction Gateway V5 Last
- Page 54 and 55: 2.6.2 Tracing 36 CICS Transaction G
- Page 56 and 57: 38 CICS Transaction Gateway V5 Inte
- Page 58 and 59: 3.1 Introduction to TCP62 40 CICS T
- Page 60 and 61: 3.1.1 Software checklist 42 CICS Tr
- Page 62 and 63: 3.3 VTAM definitions 44 CICS Transa
- Page 64 and 65: 3.4 TCP62 definitions for the CICS
- Page 66 and 67: 48 CICS Transaction Gateway V5 ►
- Page 68 and 69: 50 CICS Transaction Gateway V5 dyna
- Page 70 and 71: 52 CICS Transaction Gateway V5 Howe
- Page 72 and 73: Figure 3-6 CEMT I CONN 54 CICS Tran
- Page 74 and 75: 56 CICS Transaction Gateway V5 TCP
- Page 76 and 77: IST314I END 58 CICS Transaction Gat
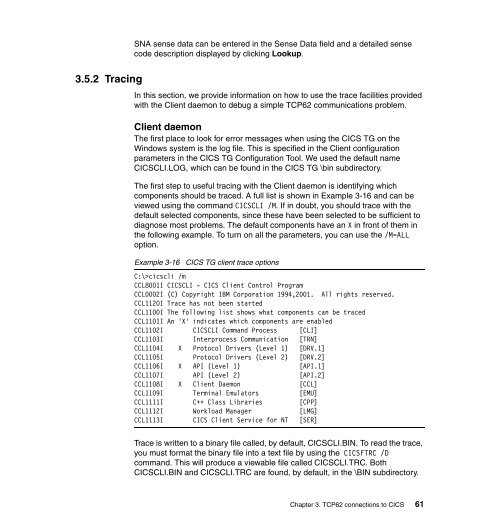
- Page 80 and 81: 62 CICS Transaction Gateway V5 The
- Page 82 and 83: 64 CICS Transaction Gateway V5 Figu
- Page 84 and 85: 4.1 Introduction to EXCI 66 CICS Tr
- Page 86 and 87: 4.2.1 EXCI CONNECTION definitions 6
- Page 88 and 89: 70 CICS Transaction Gateway V5 When
- Page 90 and 91: 4.2.3 EXCI options table: DFHXCOPT
- Page 92 and 93: 74 CICS Transaction Gateway V5 ►
- Page 94 and 95: 76 CICS Transaction Gateway V5 swit
- Page 96 and 97: 78 CICS Transaction Gateway V5 INQ
- Page 98 and 99: 4.4.2 Tracing 80 CICS Transaction G
- Page 100 and 101: 5.1 Introduction to ECI over TCP/IP
- Page 102 and 103: 5.1.2 Definitions checklist 84 CICS
- Page 104 and 105: 86 CICS Transaction Gateway V5 The
- Page 106 and 107: 88 CICS Transaction Gateway V5 Exam
- Page 108 and 109: 90 CICS Transaction Gateway V5 Figu
- Page 110 and 111: 92 CICS Transaction Gateway V5 In o
- Page 112 and 113: 94 CICS Transaction Gateway V5 MAXS
- Page 114 and 115: 96 CICS Transaction Gateway V5 PJA1
- Page 116 and 117: 98 CICS Transaction Gateway V5
- Page 118 and 119: 6.1 Introduction to CICS security 1
- Page 120 and 121: 102 CICS Transaction Gateway V5 ►
- Page 122 and 123: Basic CICS TG configuration The com
- Page 124 and 125: 106 CICS Transaction Gateway V5 Exa
- Page 126 and 127: 108 CICS Transaction Gateway V5 3.
- Page 128 and 129:
110 CICS Transaction Gateway V5 Tes
- Page 130 and 131:
6.2.2 ECI to CICS TG for Windows (T
- Page 132 and 133:
114 CICS Transaction Gateway V5 Per
- Page 134 and 135:
116 CICS Transaction Gateway V5 Sig
- Page 136 and 137:
118 CICS Transaction Gateway V5 OVE
- Page 138 and 139:
120 CICS Transaction Gateway V5 In
- Page 140 and 141:
122 CICS Transaction Gateway V5 Ver
- Page 142 and 143:
124 CICS Transaction Gateway V5 new
- Page 144 and 145:
6.3 Problem determination 6.3.1 Tip
- Page 146 and 147:
128 CICS Transaction Gateway V5 ECI
- Page 148 and 149:
130 CICS Transaction Gateway V5 EXC
- Page 150 and 151:
132 CICS Transaction Gateway V5
- Page 152 and 153:
7.1 Preparation 134 CICS Transactio
- Page 154 and 155:
7.1.3 CICS configuration 136 CICS T
- Page 156 and 157:
138 CICS Transaction Gateway V5 To
- Page 158 and 159:
140 CICS Transaction Gateway V5 cd
- Page 160 and 161:
142 CICS Transaction Gateway V5 . /
- Page 162 and 163:
144 CICS Transaction Gateway V5 spe
- Page 164 and 165:
7.2 Configuration 146 CICS Transact
- Page 166 and 167:
148 CICS Transaction Gateway V5 BPX
- Page 168 and 169:
150 CICS Transaction Gateway V5 CIC
- Page 170 and 171:
152 CICS Transaction Gateway V5 use
- Page 172 and 173:
7.2.3 EXCI pipe usage 154 CICS Tran
- Page 174 and 175:
156 CICS Transaction Gateway V5 EXC
- Page 176 and 177:
7.3 Testing the configuration 158 C
- Page 178 and 179:
160 CICS Transaction Gateway V5 Tip
- Page 180 and 181:
162 CICS Transaction Gateway V5 thi
- Page 182 and 183:
164 CICS Transaction Gateway V5 Sys
- Page 184 and 185:
166 CICS Transaction Gateway V5 2.
- Page 186 and 187:
168 CICS Transaction Gateway V5 PRI
- Page 188 and 189:
7.4.2 Tracing 170 CICS Transaction
- Page 190 and 191:
172 CICS Transaction Gateway V5 DUM
- Page 192 and 193:
174 CICS Transaction Gateway V5 Gat
- Page 194 and 195:
13:40:51:040 : ConnectionManager-0:
- Page 196 and 197:
178 CICS Transaction Gateway V5 TG
- Page 198 and 199:
180 CICS Transaction Gateway V5 Not
- Page 200 and 201:
182 CICS Transaction Gateway V5 ►
- Page 202 and 203:
184 CICS Transaction Gateway V5
- Page 204 and 205:
8.1 Preparation 186 CICS Transactio
- Page 206 and 207:
8.2 Configuration 188 CICS Transact
- Page 208 and 209:
190 CICS Transaction Gateway V5 2.
- Page 210 and 211:
192 CICS Transaction Gateway V5 For
- Page 212 and 213:
194 CICS Transaction Gateway V5 Not
- Page 214 and 215:
196 CICS Transaction Gateway V5 Val
- Page 216 and 217:
198 CICS Transaction Gateway V5 Fig
- Page 218 and 219:
200 CICS Transaction Gateway V5 Fig
- Page 220 and 221:
202 CICS Transaction Gateway V5 You
- Page 222 and 223:
204 CICS Transaction Gateway V5 1.
- Page 224 and 225:
206 CICS Transaction Gateway V5 set
- Page 226 and 227:
8.4 Problem determination 8.4.1 Tip
- Page 228 and 229:
210 CICS Transaction Gateway V5 ►
- Page 230 and 231:
212 CICS Transaction Gateway V5
- Page 232 and 233:
9.1 Preparation 214 CICS Transactio
- Page 234 and 235:
216 CICS Transaction Gateway V5 2.
- Page 236 and 237:
218 CICS Transaction Gateway V5 Exa
- Page 238 and 239:
9.2 Configuration The directory /op
- Page 240 and 241:
222 CICS Transaction Gateway V5 Fig
- Page 242 and 243:
9.3 Testing the configuration 224 C
- Page 244 and 245:
226 CICS Transaction Gateway V5 2.
- Page 246 and 247:
228 CICS Transaction Gateway V5 To
- Page 248 and 249:
9.4 Problem determination 9.4.1 Tip
- Page 250 and 251:
232 CICS Transaction Gateway V5 Dyn
- Page 252 and 253:
234 CICS Transaction Gateway V5 ret
- Page 254 and 255:
236 CICS Transaction Gateway V5
- Page 256 and 257:
10.1 Preparation 238 CICS Transacti
- Page 258 and 259:
240 CICS Transaction Gateway V5 and
- Page 260 and 261:
242 CICS Transaction Gateway V5 CTG
- Page 262 and 263:
10.2 WebSphere configuration 244 CI
- Page 264 and 265:
246 CICS Transaction Gateway V5 BBO
- Page 266 and 267:
248 CICS Transaction Gateway V5 ens
- Page 268 and 269:
10.2.4 Installing the CICS ECI reso
- Page 270 and 271:
252 CICS Transaction Gateway V5 SET
- Page 272 and 273:
254 CICS Transaction Gateway V5 Imp
- Page 274 and 275:
256 CICS Transaction Gateway V5 Fig
- Page 276 and 277:
258 CICS Transaction Gateway V5 you
- Page 278 and 279:
260 CICS Transaction Gateway V5 - S
- Page 280 and 281:
262 CICS Transaction Gateway V5 Fig
- Page 282 and 283:
264 CICS Transaction Gateway V5 Fig
- Page 284 and 285:
10.3 Testing the configuration We t
- Page 286 and 287:
268 CICS Transaction Gateway V5 its
- Page 288 and 289:
270 CICS Transaction Gateway V5 Tip
- Page 290 and 291:
272 CICS Transaction Gateway V5 CTG
- Page 292 and 293:
10.3.2 HTTP Server and basic authen
- Page 294 and 295:
We changed the following parameters
- Page 296 and 297:
278 CICS Transaction Gateway V5 Whe
- Page 298 and 299:
Security settings In WebSphere V4 f
- Page 300 and 301:
10.4.2 Tracing 282 CICS Transaction
- Page 302 and 303:
284 CICS Transaction Gateway V5 We
- Page 304 and 305:
286 CICS Transaction Gateway V5 20:
- Page 306 and 307:
288 CICS Transaction Gateway V5
- Page 308 and 309:
11.1 Preparation Web browser 290 CI
- Page 310 and 311:
292 CICS Transaction Gateway V5 ►
- Page 312 and 313:
11.2 Configuration In this section,
- Page 314 and 315:
296 CICS Transaction Gateway V5 (ra
- Page 316 and 317:
298 CICS Transaction Gateway V5 - T
- Page 318 and 319:
To install our enterprise applicati
- Page 320 and 321:
302 CICS Transaction Gateway V5 Fig
- Page 322 and 323:
304 CICS Transaction Gateway V5 4.
- Page 324 and 325:
306 CICS Transaction Gateway V5 Fig
- Page 326 and 327:
308 CICS Transaction Gateway V5 The
- Page 328 and 329:
310 CICS Transaction Gateway V5 Exa
- Page 330 and 331:
312 CICS Transaction Gateway V5 Fig
- Page 332 and 333:
314 CICS Transaction Gateway V5 Fig
- Page 334 and 335:
11.3.2 Remote testing 316 CICS Tran
- Page 336 and 337:
318 CICS Transaction Gateway V5 Fig
- Page 338 and 339:
320 CICS Transaction Gateway V5 ►
- Page 340 and 341:
322 CICS Transaction Gateway V5 J2E
- Page 342 and 343:
324 CICS Transaction Gateway V5 Fig
- Page 344 and 345:
326 CICS Transaction Gateway V5
- Page 346 and 347:
328 CICS Transaction Gateway V5
- Page 348 and 349:
ECI applications Web Browser 330 CI
- Page 350 and 351:
332 CICS Transaction Gateway V5 as
- Page 352 and 353:
Web Browser 334 CICS Transaction Ga
- Page 354 and 355:
336 CICS Transaction Gateway V5
- Page 356 and 357:
The CTGTesterECI application Applic
- Page 358 and 359:
340 CICS Transaction Gateway V5 Fie
- Page 360 and 361:
Figure B-4 Class variables 342 CICS
- Page 362 and 363:
344 CICS Transaction Gateway V5 Fir
- Page 364 and 365:
346 CICS Transaction Gateway V5 The
- Page 366 and 367:
JSPs The application uses three JSP
- Page 368 and 369:
350 CICS Transaction Gateway V5 Fig
- Page 370 and 371:
352 CICS Transaction Gateway V5
- Page 372 and 373:
354 CICS Transaction Gateway V5 Fig
- Page 374 and 375:
Application overview The following
- Page 376 and 377:
358 CICS Transaction Gateway V5 The
- Page 378 and 379:
Figure B-22 init() method 360 CICS
- Page 380 and 381:
... ... ... ... 362 CICS Transactio
- Page 382 and 383:
364 CICS Transaction Gateway V5 Res
- Page 384 and 385:
366 CICS Transaction Gateway V5 cat
- Page 386 and 387:
368 CICS Transaction Gateway V5 Fig
- Page 388 and 389:
if (managed) { getConnection(); } e
- Page 390 and 391:
372 CICS Transaction Gateway V5 The
- Page 392 and 393:
374 CICS Transaction Gateway V5 try
- Page 394 and 395:
376 CICS Transaction Gateway V5 pri
- Page 396 and 397:
378 CICS Transaction Gateway V5 Fig
- Page 398 and 399:
380 CICS Transaction Gateway V5 app
- Page 400 and 401:
382 CICS Transaction Gateway V5 Fig
- Page 402 and 403:
384 CICS Transaction Gateway V5 pag
- Page 404 and 405:
386 CICS Transaction Gateway V5 Fig
- Page 406 and 407:
388 CICS Transaction Gateway V5 app
- Page 408 and 409:
Using the Web material The addition
- Page 410 and 411:
392 CICS Transaction Gateway V5 2.
- Page 412 and 413:
394 CICS Transaction Gateway V5 4.
- Page 414 and 415:
Importing CTGTesterCCI into WebSphe
- Page 416 and 417:
398 CICS Transaction Gateway V5 3.
- Page 418 and 419:
400 CICS Transaction Gateway V5 10.
- Page 420 and 421:
402 CICS Transaction Gateway V5 Fig
- Page 422 and 423:
404 CICS Transaction Gateway V5 The
- Page 424 and 425:
406 CICS Transaction Gateway V5
- Page 426 and 427:
Referenced Web sites These Web site
- Page 428 and 429:
410 CICS Transaction Gateway V5
- Page 430 and 431:
CCL6806I, CICS TG message 178 CCL68
- Page 432 and 433:
errno, return codes 128 ESIRequest,
- Page 434 and 435:
security, with ECI requests 115 sec
- Page 436 and 437:
418 CICS Transaction Gateway V5
- Page 440:
CICS Transaction Gateway V5 The Web