Notes to the Financial Statements - Cahaya Mata Sarawak Bhd
Notes to the Financial Statements - Cahaya Mata Sarawak Bhd
Notes to the Financial Statements - Cahaya Mata Sarawak Bhd

Create successful ePaper yourself
Turn your PDF publications into a flip-book with our unique Google optimized e-Paper software.
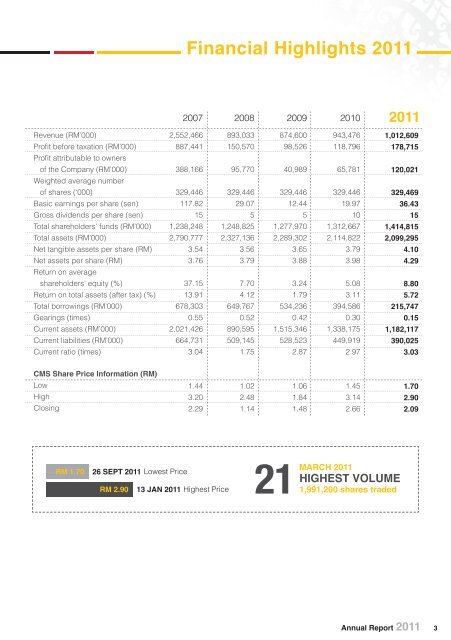
Revenue (RM’000)<br />
Profi t before taxation (RM’000)<br />
Profi t attributable <strong>to</strong> owners<br />
of <strong>the</strong> Company (RM’000)<br />
Weighted average number<br />
of shares (‘000)<br />
Basic earnings per share (sen)<br />
Gross dividends per share (sen)<br />
Total shareholders’ funds (RM’000)<br />
Total assets (RM’000)<br />
Net tangible assets per share (RM)<br />
Net assets per share (RM)<br />
Return on average<br />
shareholders’ equity (%)<br />
Return on <strong>to</strong>tal assets (after tax) (%)<br />
Total borrowings (RM’000)<br />
Gearings (times)<br />
Current assets (RM’000)<br />
Current liabilities (RM’000)<br />
Current ratio (times)<br />
CMS Share Price Information (RM)<br />
Low<br />
High<br />
Closing<br />
RM 1.70<br />
<strong>Financial</strong> Highlights 2011<br />
2007<br />
2,552,466<br />
887,441<br />
388,166<br />
329,446<br />
117.82<br />
15<br />
1,238,248<br />
2,790,777<br />
3.54<br />
3.76<br />
37.15<br />
13.91<br />
678,303<br />
0.55<br />
2,021,426<br />
664,731<br />
3.04<br />
26 SEPT 2011 Lowest Price<br />
RM 2.90<br />
1.44<br />
3.20<br />
2.29<br />
13 JAN 2011 Highest Price<br />
2008<br />
893,033<br />
150,570<br />
95,770<br />
329,446<br />
29.07<br />
5<br />
1,248,825<br />
2,327,136<br />
3.56<br />
3.79<br />
7.70<br />
4.12<br />
649,767<br />
0.52<br />
890,595<br />
509,145<br />
1.75<br />
1.02<br />
2.48<br />
1.14<br />
2009<br />
874,600<br />
98,526<br />
40,989<br />
329,446<br />
12.44<br />
5<br />
1,277,970<br />
2,289,302<br />
3.65<br />
3.88<br />
3.24<br />
1.79<br />
534,236<br />
0.42<br />
1,515,346<br />
528,523<br />
2.87<br />
21<br />
1.06<br />
1.84<br />
1.48<br />
2010<br />
943,476<br />
118,796<br />
65,781<br />
329,446<br />
19.97<br />
10<br />
1,312,667<br />
2,114,822<br />
3.79<br />
3.98<br />
5.08<br />
3.11<br />
394,586<br />
0.30<br />
1,338,175<br />
449,919<br />
2.97<br />
1.45<br />
3.14<br />
2.66<br />
2011<br />
1,012,609<br />
178,715<br />
120,021<br />
329,469<br />
36.43<br />
15<br />
1,414,815<br />
2,099,295<br />
4.10<br />
4.29<br />
8.80<br />
5.72<br />
215,747<br />
0.15<br />
1,182,117<br />
390,025<br />
3.03<br />
MARCH 2011<br />
HIGHEST VOLUME<br />
1,991,200 shares traded<br />
1.70<br />
2.90<br />
2.09<br />
Annual Report 2011 3