

Microbiology Research - Academic Journals
Microbiology Research - Academic Journals
Microbiology Research - Academic Journals

Create successful ePaper yourself
Turn your PDF publications into a flip-book with our unique Google optimized e-Paper software.
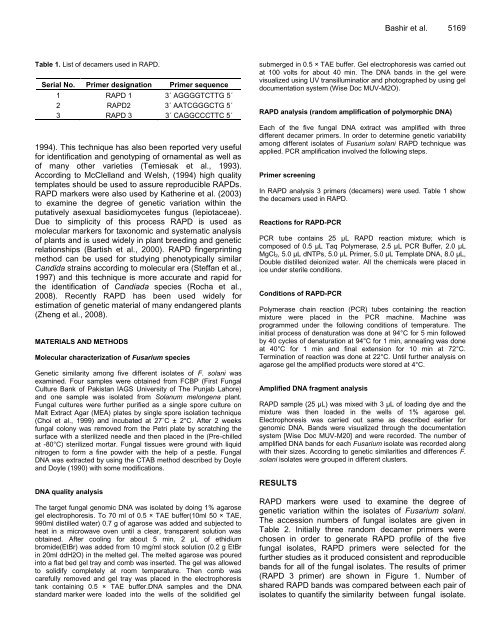
Table 1. List of decamers used in RAPD.<br />
Serial No. Primer designation Primer sequence<br />
1 RAPD 1 3΄ AGGGGTCTTG 5΄<br />
2 RAPD2 3΄ AATCGGGCTG 5΄<br />
3 RAPD 3 3΄ CAGGCCCTTC 5΄<br />
1994). This technique has also been reported very useful<br />
for identification and genotyping of ornamental as well as<br />
of many other varieties (Temiesak et al., 1993).<br />
According to McClelland and Welsh, (1994) high quality<br />
templates should be used to assure reproducible RAPDs.<br />
RAPD markers were also used by Katherine et al. (2003)<br />
to examine the degree of genetic variation within the<br />
putatively asexual basidiomycetes fungus (lepiotaceae).<br />
Due to simplicity of this process RAPD is used as<br />
molecular markers for taxonomic and systematic analysis<br />
of plants and is used widely in plant breeding and genetic<br />
relationships (Bartish et al., 2000). RAPD fingerprinting<br />
method can be used for studying phenotypically similar<br />
Candida strains according to molecular era (Steffan et al.,<br />
1997) and this technique is more accurate and rapid for<br />
the identification of Candiada species (Rocha et al.,<br />
2008). Recently RAPD has been used widely for<br />
estimation of genetic material of many endangered plants<br />
(Zheng et al., 2008).<br />
MATERIALS AND METHODS<br />
Molecular characterization of Fusarium species<br />
Genetic similarity among five different isolates of F. solani was<br />
examined. Four samples were obtained from FCBP (First Fungal<br />
Culture Bank of Pakistan IAGS University of The Punjab Lahore)<br />
and one sample was isolated from Solanum melongena plant.<br />
Fungal cultures were further purified as a single spore culture on<br />
Malt Extract Agar (MEA) plates by single spore isolation technique<br />
(Choi et al., 1999) and incubated at 27˚C ± 2°C. After 2 weeks<br />
fungal colony was removed from the Petri plate by scratching the<br />
surface with a sterilized needle and then placed in the (Pre-chilled<br />
at -80°C) sterilized mortar. Fungal tissues were ground with liquid<br />
nitrogen to form a fine powder with the help of a pestle. Fungal<br />
DNA was extracted by using the CTAB method described by Doyle<br />
and Doyle (1990) with some modifications.<br />
DNA quality analysis<br />
The target fungal genomic DNA was isolated by doing 1% agarose<br />
gel electrophoresis. To 70 ml of 0.5 × TAE buffer(10ml 50 × TAE,<br />
990ml distilled water) 0.7 g of agarose was added and subjected to<br />
heat in a microwave oven until a clear, transparent solution was<br />
obtained. After cooling for about 5 min, 2 μL of ethidium<br />
bromide(EtBr) was added from 10 mg/ml stock solution (0.2 g EtBr<br />
in 20ml ddH2O) in the melted gel. The melted agarose was poured<br />
into a flat bed gel tray and comb was inserted. The gel was allowed<br />
to solidify completely at room temperature. Then comb was<br />
carefully removed and gel tray was placed in the electrophoresis<br />
tank containing 0.5 × TAE buffer.DNA samples and the DNA<br />
standard marker were loaded into the wells of the solidified gel<br />
Bashir et al. 5169<br />
submerged in 0.5 × TAE buffer. Gel electrophoresis was carried out<br />
at 100 volts for about 40 min. The DNA bands in the gel were<br />
visualized using UV transilluminatior and photographed by using gel<br />
documentation system (Wise Doc MUV-M2O).<br />
RAPD analysis (random amplification of polymorphic DNA)<br />
Each of the five fungal DNA extract was amplified with three<br />
different decamer primers. In order to determine genetic variability<br />
among different isolates of Fusarium solani RAPD technique was<br />
applied. PCR amplification involved the following steps.<br />
Primer screening<br />
In RAPD analysis 3 primers (decamers) were used. Table 1 show<br />
the decamers used in RAPD.<br />
Reactions for RAPD-PCR<br />
PCR tube contains 25 μL RAPD reaction mixture; which is<br />
composed of 0.5 μL Taq Polymerase, 2.5 μL PCR Buffer, 2.0 μL<br />
MgCl2, 5.0 μL dNTPs, 5.0 μL Primer, 5.0 μL Template DNA, 8.0 μL,<br />
Double distilled deionized water. All the chemicals were placed in<br />
ice under sterile conditions.<br />
Conditions of RAPD-PCR<br />
Polymerase chain reaction (PCR) tubes containing the reaction<br />
mixture were placed in the PCR machine. Machine was<br />
programmed under the following conditions of temperature. The<br />
initial process of denaturation was done at 94°C for 5 min followed<br />
by 40 cycles of denaturation at 94°C for 1 min, annealing was done<br />
at 40°C for 1 min and final extension for 10 min at 72°C.<br />
Termination of reaction was done at 22°C. Until further analysis on<br />
agarose gel the amplified products were stored at 4°C.<br />
Amplified DNA fragment analysis<br />
RAPD sample (25 μL) was mixed with 3 μL of loading dye and the<br />
mixture was then loaded in the wells of 1% agarose gel.<br />
Electrophoresis was carried out same as described earlier for<br />
genomic DNA. Bands were visualized through the documentation<br />
system [Wise Doc MUV-M20] and were recorded. The number of<br />
amplified DNA bands for each Fusarium isolate was recorded along<br />
with their sizes. According to genetic similarities and differences F.<br />
solani isolates were grouped in different clusters.<br />
RESULTS<br />
RAPD markers were used to examine the degree of<br />
genetic variation within the isolates of Fusarium solani.<br />
The accession numbers of fungal isolates are given in<br />
Table 2. Initially three random decamer primers were<br />
chosen in order to generate RAPD profile of the five<br />
fungal isolates, RAPD primers were selected for the<br />
further studies as it produced consistent and reproducible<br />
bands for all of the fungal isolates. The results of primer<br />
(RAPD 3 primer) are shown in Figure 1. Number of<br />
shared RAPD bands was compared between each pair of<br />
isolates to quantify the similarity between fungal isolate.


