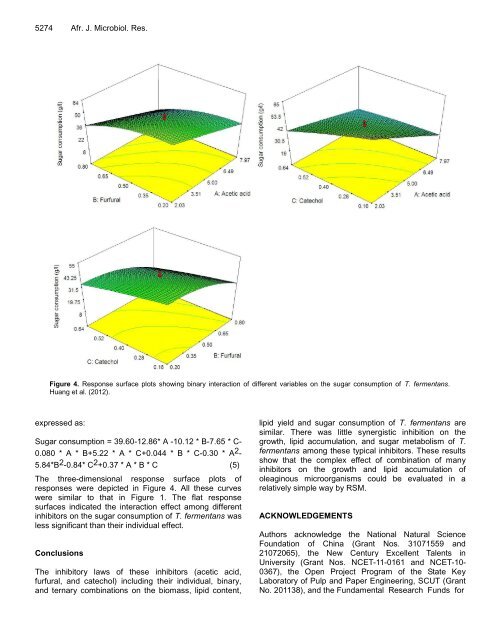
5274 Afr. J. Microbiol. Res. Figure 4. Response surface plots showing binary interaction of different variables on the sugar consumption of T. fermentans. Huang et al. (2012). expressed as: Sugar consumption = 39.60-12.86* A -10.12 * B-7.65 * C- 0.080 * A * B+5.22 * A * C+0.044 * B * C-0.30 * A 2 - 5.84*B 2 -0.84* C 2 +0.37 * A * B * C (5) The three-dimensional response surface plots of responses were depicted in Figure 4. All these curves were similar to that in Figure 1. The flat response surfaces indicated the interaction effect among different inhibitors on the sugar consumption of T. fermentans was less significant than their individual effect. Conclusions The inhibitory laws of these inhibitors (acetic acid, furfural, and catechol) including their individual, binary, and ternary combinations on the biomass, lipid content, lipid yield and sugar consumption of T. fermentans are similar. There was little synergistic inhibition on the growth, lipid accumulation, and sugar metabolism of T. fermentans among these typical inhibitors. These results show that the complex effect of combination of many inhibitors on the growth and lipid accumulation of oleaginous microorganisms could be evaluated in a relatively simple way by RSM. ACKNOWLEDGEMENTS Authors acknowledge the National Natural Science Foundation of China (Grant Nos. 31071559 and 21072065), the New Century Excellent Talents in University (Grant Nos. NCET-11-0161 and NCET-10- 0367), the Open Project Program of the State Key Laboratory of Pulp and Paper Engineering, SCUT (Grant No. 201138), and the Fundamental <strong>Research</strong> Funds for
the Central Universities (Grant No. 2012ZP0009) for financial support. REFERENCES Almeida J, Modig T, Petersson A, Hahn-Hagerdal B, Liden G, Gorwa- Grauslund M (2007). Increased tolerance and conversion of inhibitors in lignocellulosic hydrolysates by Saccharomyces cerevisiae. J. Chem. Technol. Biotechnol., 82: 340-349. Chen XF, Huang C, Xiong L, Chen XD, Ma LL (2012). Microbial oil production from corncob acid hydrolysate by Trichosporon cutaneum. Biotechnol. Lett., 34: 1025-1028. Chen X, Li Z, Zhang X, Hu F, Ryu D, Bao J (2009). Screening of oleaginous yeast strains tolerant to lignocellulose degradation compounds. Appl. Biochem. Biotechnol., 159: 1-14. Duarte LC, Carvalheiro F, Neves I, Girio FM (2005). Effects of aliphatic acids, furfural, and phenolic compounds on Debaryomyces hansenii CCMI 941. Appl. Biochem. Biotechnol., 121: 413-425. Economou CN, Aggelis G, Pavlou S, Vayenas D (2011). Single cell oil production from rice hulls hydrolysate. Bioresour. Technol., 102: 9737-9742. Hu C, Zhao X, Zhao J, Wu S, Zhao Z (2009). Effects of biomass hydrolysis by-products on oleaginous yeast Rhodosporidium toruloides. Bioresour. Technol., 100: 4843-4847. Huang C, Chen XF, Xiong L, Chen XD, Ma LL (2012). Oil production by the yeast Trichosporon dermatis cultured in enzymatic hydrolysates of corncobs. Bioresour. Technol., 110: 711-714. Huang C, Wu H, Liu QP, Li YY, Zong MH (2011). Effects of aldehydes on the growth and lipid accumulation of oleaginous yeast Trichosporon fermentans. J. Agric. Food Chem., 59: 4606-4613. Huang C, Wu H, Liu ZJ, Cai J, Lou Wy, Zong MH (2012). Effect of organic acids on the growth and lipid accumulation of oleaginous yeast Trichosporon fermentans. Biotechnol. Biofuels, 5: 4. Huang C, Zong MH, Wu H, Liu QP (2009). Microbial oil production from rice straw hydrolysate by Trichosporon fermentans. Bioresour. Technol., 100: 4535-4538. Huang et al. 5275 Li Q, Du W, Liu DH (2008). Perspectives of microbial oils for biodiesel production. Appl. Microbiol. Biotechnol., 80: 749-756. Myers R, Montgomery D, Anderson-Cook C (2009). Response Surface Methodology: Product and Process Optimization Using Designed Experiments. John Wiley & Sons, New York. Oliva J, Negro M, Sáez F, Ballesteros I, Manzanares P, González A, Ballesteros M (2006). Effects of acetic acid, furfural and catechol combinations on ethanol fermentation of Kluyveromyces marxianus. Process Biochem., 41: 1223-1228. Palmqvist E, Hahn-Hagerdal B (2000). Fermentation of lignocellulosic hydrolysates. II: inhibitors and mechanisms of inhibition. Bioresour. Technol., 74: 25-33. Papanikolaou S, Muniglia L, Chevalot I, Aggelis G, Marc I (2003). Accumulation of a cocoa-butter-like lipid by Yarrowia lipolytica cultivated on agro-industrial residues. Curr. Microbiol., 46: 124-130. Ratledge C (2004). Fatty acid biosynthesis in microorganisms being used for single cell oil production. Biochimie, 86: 807-815. Sampaio FC, Torre P, Passos FML, De Moraes CA, Perego P, Converti A (2007). Influence of inhibitory compounds and minor sugars on xylitol production by Debaryomyces hansenii. Appl. Biochem. Biotechnol., 136: 165-181. Yu X, Zheng Y, Dorgan KM, Chen S (2011). Oil production by oleaginous yeasts using the hydrolysate from pretreatment of wheat straw with dilute sulfuric acid. Bioresour. Technol., 102: 6134-6140. Zhang G, French WT, Hernandez R, Alley E, Paraschivescu M (2011). Effects of furfural and acetic acid on growth and lipid production from glucose and xylose by Rhodotorula glutinis. Biomass Bioenergy, 35: 734-740.
- Page 1 and 2:
African Journal of Microbiology Res
- Page 3 and 4:
Editors Prof. Dr. Stefan Schmidt Ap
- Page 5 and 6:
Electronic submission of manuscript
- Page 7 and 8:
Fees and Charges: Authors are requi
- Page 9 and 10:
nces Table of Contents: Volume 6 Nu
- Page 11 and 12:
Table of Contents: Volume 6 Number
- Page 13 and 14:
African Journal of Microbiology Res
- Page 15 and 16:
Table 1. Overview of the Soil prope
- Page 17 and 18:
exactly. MICROBIAL BIOMASS IN ORGAN
- Page 19 and 20:
Table 3. Advantages and disadvantag
- Page 21 and 22:
analysis of polymerase chain reacti
- Page 23 and 24:
Enzyme assay Triplicate samples of
- Page 25 and 26:
Figure 2. Effect of a) incubation t
- Page 27 and 28:
African Journal of Microbiology Res
- Page 29 and 30:
Table 2. Plasmid profile. Emerenini
- Page 31 and 32:
African Journal of Microbiology Res
- Page 33 and 34:
Table 1. Properties and identity of
- Page 35 and 36:
more understandable by the fact tha
- Page 37 and 38:
fertilizers considered the most imp
- Page 39 and 40:
Table 3. Effect of NPK levels and s
- Page 41 and 42:
Table 4. Effect of NPK levels and s
- Page 43 and 44:
Table 5. Effect of NPK levels and f
- Page 45 and 46:
with mineral NPK on wheat plant. Eg
- Page 47 and 48:
to synthetic antibiotics. In spite
- Page 49 and 50:
Among these, the K. pneumonia and V
- Page 51 and 52:
Figure 5. Pseudomonas aeruginosa An
- Page 53 and 54:
pathogens of their environment (She
- Page 55 and 56:
cultivable indigenous fishes of Ind
- Page 57 and 58:
African Journal of Microbiology Res
- Page 59 and 60:
Table 1. Oxidative stress parameter
- Page 61 and 62:
of tularemia. Ann N Y Acad. Sci., 1
- Page 63 and 64:
al., 1998; Heubuelt 1929) have alre
- Page 65 and 66:
Table 2. Influence of organic compo
- Page 67 and 68:
NO2 NO2 Zare et al. 5131 Figure 4.
- Page 69 and 70:
Sundermeyer-Klinger H, Meyer W, War
- Page 71 and 72:
Table 1. Composition of Mueller-Hin
- Page 73 and 74:
dose level, and is effective antibi
- Page 75 and 76:
wearing a mask is useful during the
- Page 77 and 78:
Novel Swine-Origin Influenza A H1N1
- Page 79 and 80:
that it produces lactic acid, bacte
- Page 81 and 82:
Figure 2. DMRT Graph, effect of var
- Page 83 and 84:
African Journal of Microbiology Res
- Page 85 and 86:
Bacillus colony Fig 1. Colony morph
- Page 87 and 88:
thuringiensis isolate S1 (Figure 6)
- Page 89 and 90:
African Journal of Microbiology Res
- Page 91 and 92:
Figure 1. The Kinetic of P. aerugin
- Page 93 and 94:
Figure 3. DNA-dosimeter determined
- Page 95 and 96:
Relative Fluorescence Unit Figure 4
- Page 97 and 98:
Conclusion The public health risk i
- Page 99 and 100:
general are members of the normal i
- Page 101 and 102:
Table 2. Distribution of Nosocomial
- Page 103 and 104:
and also to assess the influence of
- Page 105 and 106:
Table 1. List of decamers used in R
- Page 107 and 108:
Figure 2. RAPD profile of Fusarium
- Page 109 and 110:
African Journal of Microbiology Res
- Page 111 and 112:
Table 1. Biosurfactant production p
- Page 113 and 114:
Figure 3. The correlation of reduct
- Page 115 and 116:
African Journal of Microbiology Res
- Page 117 and 118:
To estimate the water content, stra
- Page 119 and 120:
Kraiem et al. 5183 Table 2. Effect
- Page 121 and 122:
log CFU/g log CFU/g log CFU/g 8.5 7
- Page 123 and 124:
delays to cooling and wrapping on s
- Page 125 and 126:
pilus (tcp) that is a subtle of pol
- Page 127 and 128:
protein. DISCUSSION 70 kda 60 kda 5
- Page 129 and 130:
African Journal of Microbiology Res
- Page 131 and 132:
Percentage repellency (%) Percentag
- Page 133 and 134:
Fumigant toxicity of essential oils
- Page 135 and 136:
Table 1. Primers used for PCR and s
- Page 137 and 138:
Table 3. Amino acid substitutions i
- Page 139 and 140:
composition in qnrB alleles. Althou
- Page 141 and 142:
African Journal of Microbiology Res
- Page 143 and 144:
Figure 1. Overview the Yongxing isl
- Page 145 and 146:
standard, XSLJ1, XSLJ2, XSLJ5, XSLJ
- Page 147 and 148:
Table 1. primer information: sequen
- Page 149 and 150:
conventional method. The reasons fo
- Page 151 and 152:
African Journal of Microbiology Res
- Page 153 and 154:
Figure 1. Comparison of amplificati
- Page 155 and 156:
Table 3. Fruiting-body formation an
- Page 157 and 158:
Yokoyama E, Yamagishi K, Hara A (20
- Page 159 and 160: Table 1. Primer oligonucleotide seq
- Page 161 and 162: Figure 2. Nucleotide and putative a
- Page 163 and 164: Figure 6. Ghrelin expression induce
- Page 165 and 166: African Journal of Microbiology Res
- Page 167 and 168: Table 1. The SNPs related to the pr
- Page 169 and 170: Figure 2. The phylogenetic trees of
- Page 171 and 172: a c Rex DNA Tang et al. 5235 Figure
- Page 173 and 174: African Journal of Microbiology Res
- Page 175 and 176: Table 1. Gender and division wise d
- Page 177 and 178: 62% were genotype D, A (14%), C (6%
- Page 179 and 180: African Journal of Microbiology Res
- Page 181 and 182: Swimming time (s) 1000 800 600 400
- Page 183 and 184: Hepatic glycogen (mg/g) Hemoglobin
- Page 185 and 186: African Journal of Microbiology Res
- Page 187 and 188: Table 2. Sporulation index. Sign In
- Page 189 and 190: Table 4. Conidial size of different
- Page 191 and 192: Table 6. Sporulation of Alternaria
- Page 193 and 194: Table 7. Reaction of different geno
- Page 195 and 196: African Journal of Microbiology Res
- Page 197 and 198: Table 2. Susceptibility of the clin
- Page 199 and 200: Table 4. Aminoglycoside resistance
- Page 201 and 202: Young, and the Councils on Clinical
- Page 203 and 204: oleaginous microorganisms have been
- Page 205 and 206: Table 2. Actual and predicted value
- Page 207 and 208: Table 4. Analysis of variance (ANOV
- Page 209: Huang et al. 5273 Figure 3. Respons
- Page 213 and 214: Figure 1. Mechanism of enzymatic co
- Page 215 and 216: Enzymatic activity (U/mL) Enzymatic
- Page 217 and 218: prunin so far. By using the HPLC me
- Page 219 and 220: Figure 7. Enzymatic conversion of n
- Page 221 and 222: African Journal of Microbiology Res
- Page 223 and 224: vaccine, HBs-Ab is negative in all
- Page 225 and 226: Conferences and Advert August 2012