Download (2.2 MB) - Volksbank AG
Download (2.2 MB) - Volksbank AG
Download (2.2 MB) - Volksbank AG

You also want an ePaper? Increase the reach of your titles
YUMPU automatically turns print PDFs into web optimized ePapers that Google loves.
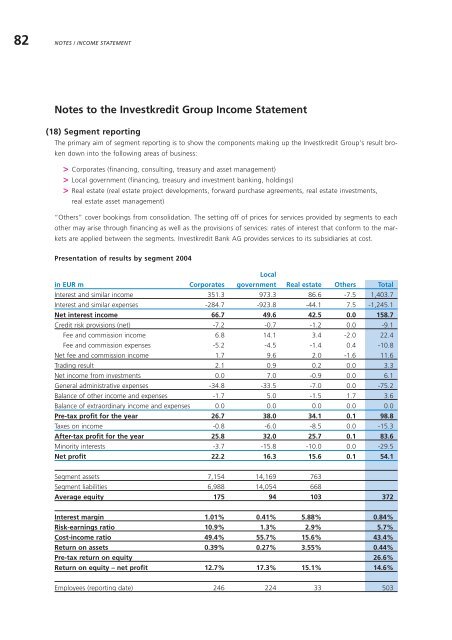
82 NOTES / INCOME STATEMENT<br />
Notes to the Investkredit Group Income Statement<br />
(18) Segment reporting<br />
The primary aim of segment reporting is to show the components making up the Investkredit Group's result broken<br />
down into the following areas of business:<br />
> Corporates (financing, consulting, treasury and asset management)<br />
> Local government (financing, treasury and investment banking, holdings)<br />
> Real estate (real estate project developments, forward purchase agreements, real estate investments,<br />
real estate asset management)<br />
“Others” cover bookings from consolidation. The setting off of prices for services provided by segments to each<br />
other may arise through financing as well as the provisions of services: rates of interest that conform to the markets<br />
are applied between the segments. Investkredit Bank <strong>AG</strong> provides services to its subsidiaries at cost.<br />
Presentation of results by segment 2004<br />
in EUR m Corporates<br />
Local<br />
government Real estate Others Total<br />
Interest and similar income 351.3 973.3 86.6 -7.5 1,403.7<br />
Interest and similar expenses -284.7 -923.8 -44.1 7.5 -1,245.1<br />
Net interest income 66.7 49.6 42.5 0.0 158.7<br />
Credit risk provisions (net) -7.2 -0.7 -1.2 0.0 -9.1<br />
Fee and commission income 6.8 14.1 3.4 -2.0 22.4<br />
Fee and commission expenses -5.2 -4.5 -1.4 0.4 -10.8<br />
Net fee and commission income 1.7 9.6 2.0 -1.6 11.6<br />
Trading result 2.1 0.9 0.2 0.0 3.3<br />
Net income from investments 0.0 7.0 -0.9 0.0 6.1<br />
General administrative expenses -34.8 -33.5 -7.0 0.0 -75.2<br />
Balance of other income and expenses -1.7 5.0 -1.5 1.7 3.6<br />
Balance of extraordinary income and expenses 0.0 0.0 0.0 0.0 0.0<br />
Pre-tax profit for the year 26.7 38.0 34.1 0.1 98.8<br />
Taxes on income -0.8 -6.0 -8.5 0.0 -15.3<br />
After-tax profit for the year 25.8 32.0 25.7 0.1 83.6<br />
Minority interests -3.7 -15.8 -10.0 0.0 -29.5<br />
Net profit 2<strong>2.2</strong> 16.3 15.6 0.1 54.1<br />
Segment assets 7,154 14,169 763<br />
Segment liabilities 6,988 14,054 668<br />
Average equity 175 94 103 372<br />
Interest margin 1.01% 0.41% 5.88% 0.84%<br />
Risk-earnings ratio 10.9% 1.3% 2.9% 5.7%<br />
Cost-income ratio 49.4% 55.7% 15.6% 43.4%<br />
Return on assets 0.39% 0.27% 3.55% 0.44%<br />
Pre-tax return on equity 26.6%<br />
Return on equity – net profit 12.7% 17.3% 15.1% 14.6%<br />
Employees (reporting date) 246 224 33 503