Download (2.2 MB) - Volksbank AG
Download (2.2 MB) - Volksbank AG
Download (2.2 MB) - Volksbank AG

You also want an ePaper? Increase the reach of your titles
YUMPU automatically turns print PDFs into web optimized ePapers that Google loves.
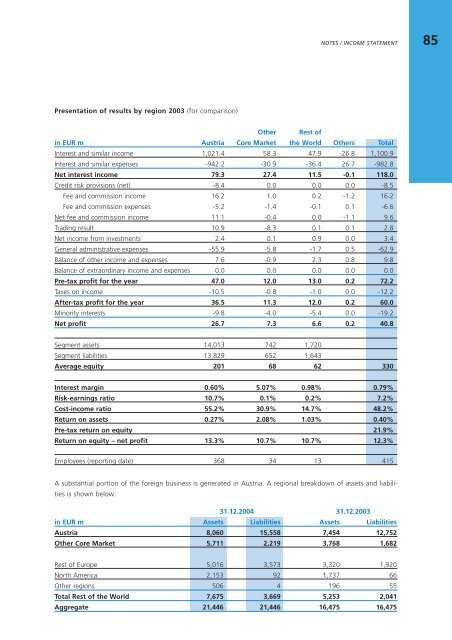
Presentation of results by region 2003 (for comparison)<br />
Other Rest of<br />
NOTES / INCOME STATEMENT<br />
in EUR m Austria Core Market the World Others Total<br />
Interest and similar income 1,021.4 58.3 47.9 -26.8 1,100.9<br />
Interest and similar expenses -94<strong>2.2</strong> -30.9 -36.4 26.7 -982.8<br />
Net interest income 79.3 27.4 11.5 -0.1 118.0<br />
Credit risk provisions (net) -8.4 0.0 0.0 0.0 -8.5<br />
Fee and commission income 16.2 1.0 0.2 -1.2 16.2<br />
Fee and commission expenses -5.2 -1.4 -0.1 0.1 -6.6<br />
Net fee and commission income 11.1 -0.4 0.0 -1.1 9.6<br />
Trading result 10.9 -8.3 0.1 0.1 2.8<br />
Net income from investments 2.4 0.1 0.9 0.0 3.4<br />
General administrative expenses -55.9 -5.8 -1.7 0.5 -62.9<br />
Balance of other income and expenses 7.6 -0.9 2.3 0.8 9.8<br />
Balance of extraordinary income and expenses 0.0 0.0 0.0 0.0 0.0<br />
Pre-tax profit for the year 47.0 12.0 13.0 0.2 7<strong>2.2</strong><br />
Taxes on income -10.5 -0.8 -1.0 0.0 -1<strong>2.2</strong><br />
After-tax profit for the year 36.5 11.3 12.0 0.2 60.0<br />
Minority interests -9.8 -4.0 -5.4 0.0 -19.2<br />
Net profit 26.7 7.3 6.6 0.2 40.8<br />
Segment assets 14,013 742 1,720<br />
Segment liabilities 13,829 652 1,643<br />
Average equity 201 68 62 330<br />
Interest margin 0.60% 5.07% 0.98% 0.79%<br />
Risk-earnings ratio 10.7% 0.1% 0.2% 7.2%<br />
Cost-income ratio 55.2% 30.9% 14.7% 48.2%<br />
Return on assets 0.27% 2.08% 1.03% 0.40%<br />
Pre-tax return on equity 21.9%<br />
Return on equity – net profit 13.3% 10.7% 10.7% 12.3%<br />
Employees (reporting date) 368 34 13 415<br />
A substantial portion of the foreign business is generated in Austria. A regional breakdown of assets and liabilities<br />
is shown below:<br />
31.1<strong>2.2</strong>004 31.1<strong>2.2</strong>003<br />
in EUR m Assets Liabilities Assets Liabilities<br />
Austria 8,060 15,558 7,454 12,752<br />
Other Core Market 5,711 2,219 3,768 1,682<br />
Rest of Europe 5,016 3,573 3,320 1,920<br />
North America 2,153 92 1,737 66<br />
Other regions 506 4 196 55<br />
Total Rest of the World 7,675 3,669 5,253 2,041<br />
Aggregate 21,446 21,446 16,475 16,475<br />
85