Economic Effects of Sustainable Sanitation - SuSanA
Economic Effects of Sustainable Sanitation - SuSanA
Economic Effects of Sustainable Sanitation - SuSanA

Create successful ePaper yourself
Turn your PDF publications into a flip-book with our unique Google optimized e-Paper software.
<strong>Sanitation</strong>: facts and interrelationships<br />
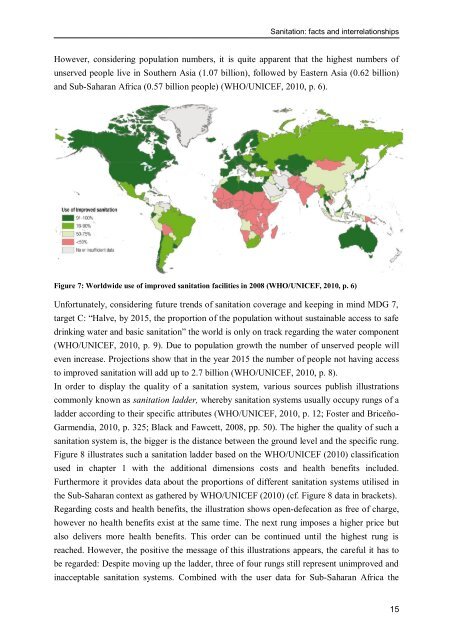
However, considering population numbers, it is quite apparent that the highest numbers <strong>of</strong><br />
unserved people live in Southern Asia (1.07 billion), followed by Eastern Asia (0.62 billion)<br />
and Sub-Saharan Africa (0.57 billion people) (WHO/UNICEF, 2010, p. 6).<br />
Figure 7: Worldwide use <strong>of</strong> improved sanitation facilities in 2008 (WHO/UNICEF, 2010, p. 6)<br />
Unfortunately, considering future trends <strong>of</strong> sanitation coverage and keeping in mind MDG 7,<br />
target C: ―Halve, by 2015, the proportion <strong>of</strong> the population without sustainable access to safe<br />
drinking water and basic sanitation‖ the world is only on track regarding the water component<br />
(WHO/UNICEF, 2010, p. 9). Due to population growth the number <strong>of</strong> unserved people will<br />
even increase. Projections show that in the year 2015 the number <strong>of</strong> people not having access<br />
to improved sanitation will add up to 2.7 billion (WHO/UNICEF, 2010, p. 8).<br />
In order to display the quality <strong>of</strong> a sanitation system, various sources publish illustrations<br />
commonly known as sanitation ladder, whereby sanitation systems usually occupy rungs <strong>of</strong> a<br />
ladder according to their specific attributes (WHO/UNICEF, 2010, p. 12; Foster and Briceño-<br />
Garmendia, 2010, p. 325; Black and Fawcett, 2008, pp. 50). The higher the quality <strong>of</strong> such a<br />
sanitation system is, the bigger is the distance between the ground level and the specific rung.<br />
Figure 8 illustrates such a sanitation ladder based on the WHO/UNICEF (2010) classification<br />
used in chapter 1 with the additional dimensions costs and health benefits included.<br />
Furthermore it provides data about the proportions <strong>of</strong> different sanitation systems utilised in<br />
the Sub-Saharan context as gathered by WHO/UNICEF (2010) (cf. Figure 8 data in brackets).<br />
Regarding costs and health benefits, the illustration shows open-defecation as free <strong>of</strong> charge,<br />
however no health benefits exist at the same time. The next rung imposes a higher price but<br />
also delivers more health benefits. This order can be continued until the highest rung is<br />
reached. However, the positive the message <strong>of</strong> this illustrations appears, the careful it has to<br />
be regarded: Despite moving up the ladder, three <strong>of</strong> four rungs still represent unimproved and<br />
inacceptable sanitation systems. Combined with the user data for Sub-Saharan Africa the<br />
15