Economic Effects of Sustainable Sanitation - SuSanA
Economic Effects of Sustainable Sanitation - SuSanA
Economic Effects of Sustainable Sanitation - SuSanA

You also want an ePaper? Increase the reach of your titles
YUMPU automatically turns print PDFs into web optimized ePapers that Google loves.
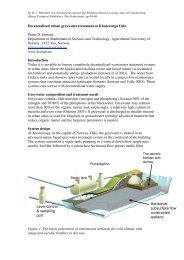
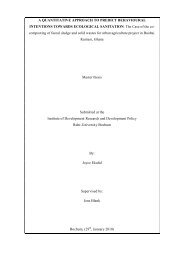
Figure 13: Logistics system for urine reuse - system A (own contribution)<br />
6.2.2.2 Costs <strong>of</strong> the urine logistics<br />
Case Study Kampala<br />
The costs <strong>of</strong> the logistics system have been calculated with the assistance <strong>of</strong> a Micros<strong>of</strong>t<br />
Excel based model (cf. chapter 9.3). The model was exclusively developed for this purpose.<br />
Various assumptions have been used in this model and different scenarios have been<br />
calculated in order to simulate different system sizes (cf. Table 5).<br />
The income for system A is generated through the marketing <strong>of</strong> the sanitised, liquid fertiliser -<br />
human urine. A price for one litre <strong>of</strong> this fertiliser was calculated using the replacement cost<br />
approach (cf. Drechsel, 2004). In this context, the price adds up to 0.01 EUR per litre. The<br />
major input parameter in order to assess the scale <strong>of</strong> the system is the N demand <strong>of</strong> the farm.<br />
The location <strong>of</strong> the farm was set to be 50 km outside Kampala, which was considered to be<br />
the average distance from the city centre to the locations <strong>of</strong> large scale agricultural production<br />
outside the city. The distance <strong>of</strong> the slums to the storage site is estimated to be 10 km.<br />
The scenarios are calculated with a five year lifetime and the system is working at full<br />
capacity in 10 000 l units 61 . A collection efficiency <strong>of</strong> 30% 62 is used for calculating the<br />
amount <strong>of</strong> people being affected by the system, considering that many people are absent<br />
during the day because <strong>of</strong> employments outside the area observed. The average volume <strong>of</strong><br />
61 The capacities <strong>of</strong> the individual components are: collection point tanks (10 000 l), tank trucks (10 000 l) and<br />
storage tanks (24 000 l). Since a major share <strong>of</strong> the total costs is contributed by the transport costs and one truck<br />
has the capacity <strong>of</strong> 10 000 l this volume is used as reference value or unit for the workload.<br />
62 The collection efficiency <strong>of</strong> 30% is an assumption.<br />
58