Economic Effects of Sustainable Sanitation - SuSanA
Economic Effects of Sustainable Sanitation - SuSanA
Economic Effects of Sustainable Sanitation - SuSanA

You also want an ePaper? Increase the reach of your titles
YUMPU automatically turns print PDFs into web optimized ePapers that Google loves.
Case Study Kampala<br />
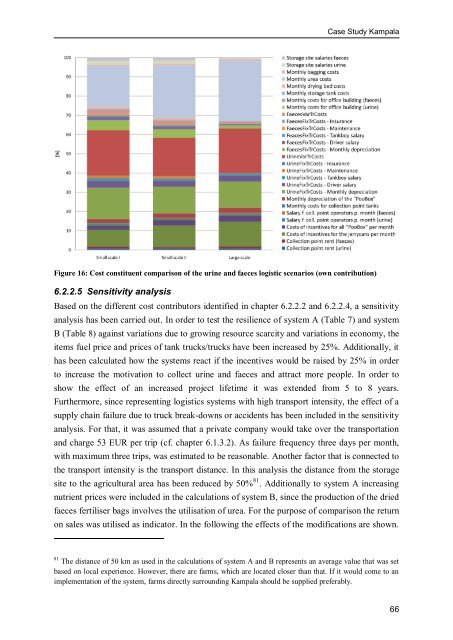
Figure 16: Cost constituent comparison <strong>of</strong> the urine and faeces logistic scenarios (own contribution)<br />
6.2.2.5 Sensitivity analysis<br />
Based on the different cost contributors identified in chapter 6.2.2.2 and 6.2.2.4, a sensitivity<br />
analysis has been carried out. In order to test the resilience <strong>of</strong> system A (Table 7) and system<br />
B (Table 8) against variations due to growing resource scarcity and variations in economy, the<br />
items fuel price and prices <strong>of</strong> tank trucks/trucks have been increased by 25%. Additionally, it<br />
has been calculated how the systems react if the incentives would be raised by 25% in order<br />
to increase the motivation to collect urine and faeces and attract more people. In order to<br />
show the effect <strong>of</strong> an increased project lifetime it was extended from 5 to 8 years.<br />
Furthermore, since representing logistics systems with high transport intensity, the effect <strong>of</strong> a<br />
supply chain failure due to truck break-downs or accidents has been included in the sensitivity<br />
analysis. For that, it was assumed that a private company would take over the transportation<br />
and charge 53 EUR per trip (cf. chapter 6.1.3.2). As failure frequency three days per month,<br />
with maximum three trips, was estimated to be reasonable. Another factor that is connected to<br />
the transport intensity is the transport distance. In this analysis the distance from the storage<br />
site to the agricultural area has been reduced by 50% 81 . Additionally to system A increasing<br />
nutrient prices were included in the calculations <strong>of</strong> system B, since the production <strong>of</strong> the dried<br />
faeces fertiliser bags involves the utilisation <strong>of</strong> urea. For the purpose <strong>of</strong> comparison the return<br />
on sales was utilised as indicator. In the following the effects <strong>of</strong> the modifications are shown.<br />
81 The distance <strong>of</strong> 50 km as used in the calculations <strong>of</strong> system A and B represents an average value that was set<br />
based on local experience. However, there are farms, which are located closer than that. If it would come to an<br />
implementation <strong>of</strong> the system, farms directly surrounding Kampala should be supplied preferably.<br />
66