Project Green District Energy Feasibility Study - Partners in Project ...
Project Green District Energy Feasibility Study - Partners in Project ...
Project Green District Energy Feasibility Study - Partners in Project ...

You also want an ePaper? Increase the reach of your titles
YUMPU automatically turns print PDFs into web optimized ePapers that Google loves.
TRCA Pearson Eco-Bus<strong>in</strong>ess Zone <strong>District</strong> <strong>Energy</strong> <strong>Feasibility</strong> <strong>Study</strong> 10 April 2012<br />
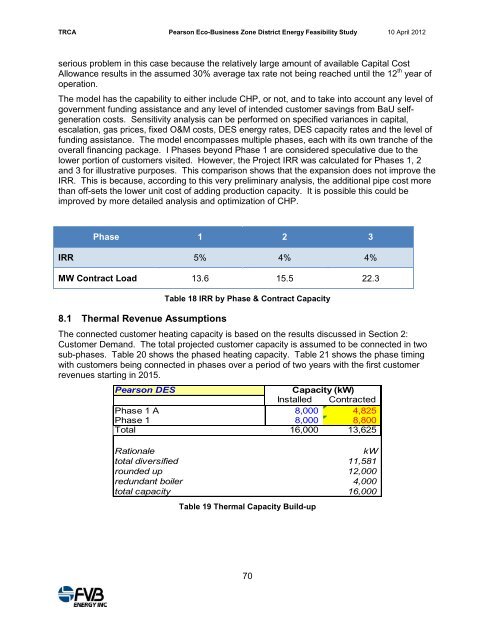
serious problem <strong>in</strong> this case because the relatively large amount of available Capital Cost<br />
Allowance results <strong>in</strong> the assumed 30% average tax rate not be<strong>in</strong>g reached until the 12 th year of<br />
operation.<br />
The model has the capability to either <strong>in</strong>clude CHP, or not, and to take <strong>in</strong>to account any level of<br />
government fund<strong>in</strong>g assistance and any level of <strong>in</strong>tended customer sav<strong>in</strong>gs from BaU selfgeneration<br />
costs. Sensitivity analysis can be performed on specified variances <strong>in</strong> capital,<br />
escalation, gas prices, fixed O&M costs, DES energy rates, DES capacity rates and the level of<br />
fund<strong>in</strong>g assistance. The model encompasses multiple phases, each with its own tranche of the<br />
overall f<strong>in</strong>anc<strong>in</strong>g package. I Phases beyond Phase 1 are considered speculative due to the<br />
lower portion of customers visited. However, the <strong>Project</strong> IRR was calculated for Phases 1, 2<br />
and 3 for illustrative purposes. This comparison shows that the expansion does not improve the<br />
IRR. This is because, accord<strong>in</strong>g to this very prelim<strong>in</strong>ary analysis, the additional pipe cost more<br />
than off-sets the lower unit cost of add<strong>in</strong>g production capacity. It is possible this could be<br />
improved by more detailed analysis and optimization of CHP.<br />
Phase 1 2 3<br />
IRR 5% 4% 4%<br />
MW Contract Load 13.6 15.5 22.3<br />
8.1 Thermal Revenue Assumptions<br />
Table 18 IRR by Phase & Contract Capacity<br />
The connected customer heat<strong>in</strong>g capacity is based on the results discussed <strong>in</strong> Section 2:<br />
Customer Demand. The total projected customer capacity is assumed to be connected <strong>in</strong> two<br />
sub-phases. Table 20 shows the phased heat<strong>in</strong>g capacity. Table 21 shows the phase tim<strong>in</strong>g<br />
with customers be<strong>in</strong>g connected <strong>in</strong> phases over a period of two years with the first customer<br />
revenues start<strong>in</strong>g <strong>in</strong> 2015.<br />
Pearson DES<br />
Capacity (kW)<br />
Installed Contracted<br />
Phase 1 A 8,000 4,825<br />
Phase 1 8,000 8,800<br />
Total 16,000 13,625<br />
Rationale kW<br />
total diversified 11,581<br />
rounded up 12,000<br />
redundant boiler 4,000<br />
total capacity 16,000<br />
Table 19 Thermal Capacity Build-up<br />
70