- Page 2 and 3:
ACKNOWLEDGEMENTS This research has
- Page 4 and 5:
Section Two: Lottery expenditure on
- Page 6 and 7:
List of tables 1 Dance field: Stage
- Page 8 and 9:
67 TMA audience data by genre for a
- Page 10 and 11:
as a domestic one. I know we have t
- Page 12 and 13:
dance • identify trends in the da
- Page 14 and 15:
in the broadcasting and commercial
- Page 16 and 17:
• the low levels of pay affect th
- Page 18 and 19:
hip hop. The core ballet repertoire
- Page 20 and 21:
PART ONE: Background 1. Introductio
- Page 22 and 23:
Stage one set out to identify what
- Page 24 and 25:
organisations and local government
- Page 26 and 27:
living through dance but also amate
- Page 28 and 29:
3. Normative isomorphism results pr
- Page 30 and 31:
A changing UK demographic has influ
- Page 32 and 33:
1987/1988 1997/98 2007/2008 Total A
- Page 34 and 35:
This categorisation has been adopte
- Page 36 and 37:
• primary research through online
- Page 38 and 39:
PART THREE: Political ‘The real c
- Page 40 and 41:
It outlines a set of national objec
- Page 42 and 43:
• a central Grants for the arts p
- Page 44 and 45:
‘The Government is pleased to be
- Page 46 and 47:
The DCMS responded by identifying t
- Page 48 and 49:
As a direct result of the review, t
- Page 50 and 51:
‘The National Campaign for the Ar
- Page 52 and 53:
2008/9 along with potential booking
- Page 54 and 55:
promoters, venue managers and festi
- Page 56 and 57:
But now cultural leaders are warnin
- Page 58 and 59:
increased political awareness of ho
- Page 60 and 61:
PART FOUR: Economy The dance econom
- Page 62 and 63: Large-scale: capacity in excess of
- Page 64 and 65: aesthetic and production values. Ho
- Page 66 and 67: force organisations to amend their
- Page 68 and 69: 2007/08 £s 2008/09 £s 2009/10 £s
- Page 70 and 71: The list of organisations in table
- Page 72 and 73: The rapid growth of some of these o
- Page 74 and 75: ecomes 239,473 total engagement, wh
- Page 76 and 77: Source: Arts Council England dance
- Page 78 and 79: 2004- 2007 there was no dance compa
- Page 80 and 81: Across the three year period the pr
- Page 82 and 83: Some fluctuations may occur to thes
- Page 84 and 85: DTP Core members are: Brighton Dome
- Page 86 and 87: Producing and Touring Companies Eas
- Page 88 and 89: There is more touring data availabl
- Page 90 and 91: When asked if they had a dedicated
- Page 92 and 93: Figure 3: Marketing the dance progr
- Page 94 and 95: • ‘To find ways to engage audie
- Page 96 and 97: Table 28 shows the average expendit
- Page 98 and 99: Figure 4: Local authorities’ danc
- Page 100 and 101: • ‘Due to budget restrictions t
- Page 102 and 103: Cultural organisations and business
- Page 104 and 105: Region Total private investment Lon
- Page 106 and 107: There were other capital projects,
- Page 108 and 109: In terms of looking at the asset cl
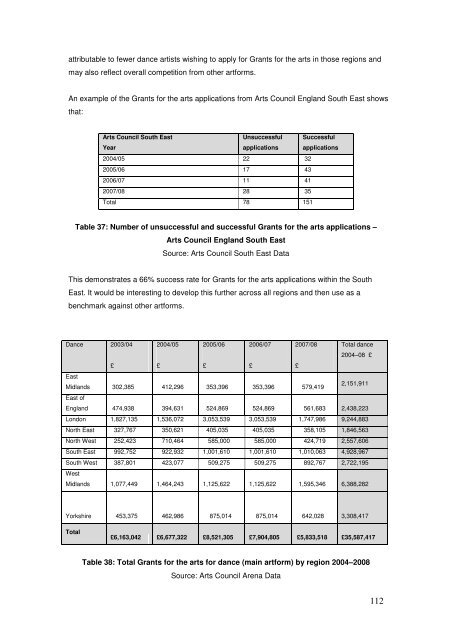
- Page 110 and 111: £516,859,357 to 18 dance projects.
- Page 114 and 115: Region/ Sub dance form Total contem
- Page 116 and 117: • Demand - a more educated and di
- Page 118 and 119: and importantly, managing independe
- Page 120 and 121: support the work of the charity and
- Page 122 and 123: Copyright does not protect ideas or
- Page 124 and 125: References Baumol W J and Bowen WG
- Page 126 and 127: Ryan (1992) examined the organisati
- Page 128 and 129: The implications of this are that w
- Page 130 and 131: 2. A diverse workforce Dance in Eng
- Page 132 and 133: Contemporary 516 64.3% Creative 253
- Page 134 and 135: Leadership • Dance appears to lac
- Page 136 and 137: 40% of schools within the SSPs had
- Page 138 and 139: • the lack of dance specialists w
- Page 140 and 141: % Table 51:Overall student numbers:
- Page 142 and 143: However, the largest group of progr
- Page 144 and 145: These partnerships appear to be gro
- Page 146 and 147: The workforce is concentrated in th
- Page 148 and 149: Further analysis of the membership
- Page 150 and 151: Funding Are we training too many da
- Page 152 and 153: ‘Keeping traditional dance alive
- Page 154 and 155: expertise and skill could be of maj
- Page 156 and 157: FCD % NDTA % South East 219 15 221
- Page 158 and 159: One respondent stated that the majo
- Page 160 and 161: Katie Green Katie did not envisage
- Page 162 and 163:
have excellent leaders but that the
- Page 164 and 165:
although there are several high pro
- Page 166 and 167:
• artist as leader of a producing
- Page 168 and 169:
many for whom their practice is sti
- Page 170 and 171:
within it work across the field in
- Page 172 and 173:
Hansen, RS (2009) Quintessential Ca
- Page 174 and 175:
• upgrading and modernising our d
- Page 176 and 177:
• successful regional roll out of
- Page 178 and 179:
• Broadcasting and narrow-casting
- Page 180 and 181:
The report points out that a number
- Page 182 and 183:
Creative uses Working in the virtua
- Page 184 and 185:
network users and to generate dialo
- Page 186 and 187:
Cinema through digital and film age
- Page 188 and 189:
Dance’s central preoccupation wit
- Page 190 and 191:
References marketing and distributi
- Page 192 and 193:
the wrong reasons - the viewers' re
- Page 194 and 195:
‘From ballroom to breakdance, hor
- Page 196 and 197:
Theatre dance and popular forms are
- Page 198 and 199:
o stronger muscles o stronger bones
- Page 200 and 201:
promote dance as a fun, physical an
- Page 202 and 203:
In terms of educational qualificati
- Page 204 and 205:
The survey found that attendance at
- Page 206 and 207:
this in a more sophisticated way by
- Page 208 and 209:
Heather Maitland’s research for D
- Page 210 and 211:
The Phase Two research then focusse
- Page 212 and 213:
Brand loyalty As an increasingly br
- Page 214 and 215:
Type of work No of perfs Paid Atten
- Page 216 and 217:
egional dance agency in programming
- Page 218 and 219:
24 different companies worked with
- Page 220 and 221:
Region Multi-arts groups Multi-artf
- Page 222 and 223:
• The voluntary arts sector is of
- Page 224 and 225:
Creative adult learning There are 4
- Page 226 and 227:
Children, Schools and Families and
- Page 228 and 229:
The StepBack project supports inclu
- Page 230 and 231:
15. Key Findings Dance is a social
- Page 232 and 233:
Audiences London (2006) Contemporar
- Page 234 and 235:
2. Talking about dance When asked t
- Page 236 and 237:
people could have quality. In dance
- Page 238 and 239:
‘Excellent culture takes and comb
- Page 240 and 241:
contemporary genre. Populist progra
- Page 242 and 243:
The survey of venues received 61 re
- Page 244 and 245:
Birmingham Hippodrome Theatre, Birm
- Page 246 and 247:
The impact of ANDA and now NDN’s
- Page 248 and 249:
There needs to be more work done to
- Page 250 and 251:
PART NINE: Conclusion Introduction
- Page 252 and 253:
We have sought to tabulate some of
- Page 254 and 255:
the balance of provision currently
- Page 256 and 257:
Appendices 1. Consultants Biographi
- Page 258 and 259:
Appendix 2 Arts Council England Con
- Page 260 and 261:
3 Requirements This process will in
- Page 262 and 263:
Queries should be addressed to: Jan
- Page 264 and 265:
ARTS COUNCIL ENGLAND (2008) What Pe
- Page 266 and 267:
DEDA (2007) East Midlands: Dance Au
- Page 268 and 269:
PFEFFER, J and SALANCIK GR. 2003 Th
- Page 270 and 271:
1969 -1979 1979 - 1989 1989 - 1999
- Page 272 and 273:
1969 -1979 1979 - 1989 1989 - 1999
- Page 274 and 275:
Political Shifts Associated develop
- Page 276 and 277:
ut few companies seem to be benefit
- Page 278 and 279:
Appendix 6 (a) RFO Data Descriptors
- Page 280 and 281:
West Midlands Dance South West Glou
- Page 282 and 283:
StopgapDance Co South West Attik Da
- Page 284 and 285:
Dance4 Ltd www.dance4.co.uk Region:
- Page 286 and 287:
commissioning, exhibiting, curating
- Page 288 and 289:
173,482 178,166 182,976 George Pipe
- Page 290 and 291:
Shobana Jeyasingh presents original
- Page 292 and 293:
and Continued Professional Developm
- Page 294 and 295:
60,566 62,201 63,881 Woking Dance F
- Page 296 and 297:
internationally. Our investment hel
- Page 298 and 299:
Jabadao www.jabadao.org Region: Yor
- Page 300 and 301:
Appendix 7 List of Those Consulted
- Page 302 and 303:
Candida Elton Regional Artist-Deda
- Page 304 and 305:
Emma Gladstone Sadler’s Wells (pr
- Page 306 and 307:
Amanda Drago Falling Cat Joelene En
- Page 308 and 309:
Lisa Cullen University of Salford A
- Page 310 and 311:
Question 2: Arts Development Staff
- Page 312 and 313:
Question 4: Please indicate budget
- Page 314 and 315:
Question 5: Please indicate budget
- Page 316 and 317:
Question 6: Please indicate budget
- Page 318 and 319:
Year on Year comparison: Below are
- Page 320 and 321:
Question 8: How many venues in your
- Page 322 and 323:
Question 10: How would you estimate
- Page 324 and 325:
Question 12: Dance Workforce Answer
- Page 326 and 327:
Private Teachers/ Schools Voluntary
- Page 328 and 329:
Question 13: Do you invest in Conti
- Page 330 and 331:
Question Three: Age Answered 795 Sk
- Page 332 and 333:
Question 5: If you answered yes in
- Page 334 and 335:
Question 7: Please tick any of the
- Page 336 and 337:
Question 9: Which of the following
- Page 338 and 339:
Question 11: What do you think are
- Page 340 and 341:
The Junction Waterside Arts Centre
- Page 342 and 343:
Question 3: Please give an indicati
- Page 344 and 345:
Are you a commercial venue? Answere
- Page 346 and 347:
Is your venue a member of a Dance T
- Page 348 and 349:
Question 6: Please indicate the siz
- Page 350 and 351:
350
- Page 352 and 353:
Question 9: How do you identify com
- Page 354 and 355:
Question 11: What tools do you use
- Page 356 and 357:
Question 13: What do you think are
- Page 358 and 359:
Respondent B Region West Midland (S
- Page 360 and 361:
Respondent D Region West Midlands (
- Page 362 and 363:
Respondent F Region South East Age
- Page 364 and 365:
Respondent H Region London Age 20-2
- Page 366 and 367:
Respondent J Region South West Age
- Page 368 and 369:
Respondent L Region London Age 51-6
- Page 370 and 371:
Respondent N Region London Age 36-5
- Page 372 and 373:
Respondent P Region East Do you ear
- Page 374 and 375:
Respondent R Region London Age 26-3
- Page 376 and 377:
Respondent T Region Yorkshire Age 2
- Page 378 and 379:
dance workforce is not diverse enou
- Page 380:
I want to add my thanks to Alan’s


![More than potato prints [PDF 451.9 KB] - Arts Council England](https://img.yumpu.com/19437752/1/190x135/more-than-potato-prints-pdf-4519-kb-arts-council-england.jpg?quality=85)