Aerodynamics and Design for Ultra-Low Reynolds Number Flight
Aerodynamics and Design for Ultra-Low Reynolds Number Flight
Aerodynamics and Design for Ultra-Low Reynolds Number Flight

Create successful ePaper yourself
Turn your PDF publications into a flip-book with our unique Google optimized e-Paper software.
Chapter 6<br />
10% <strong>for</strong> the other samples. This coincides with predictions of increasing regions of stall<br />
near the tip. This is rein<strong>for</strong>ced by similar behavior in the OVERFLOW-D results.<br />
112<br />
Power Req. (W)<br />
0.8<br />
0.6<br />
0.4<br />
0.2<br />
0.0<br />
Reduced-order Method<br />
OVERFLOW-D<br />
Sample 1<br />
Sample 2<br />
Sample 3 (Al)<br />
Sample 4<br />
Small Hub Version<br />
10000 20000 30000 40000<br />
RPM<br />
50000 60000<br />
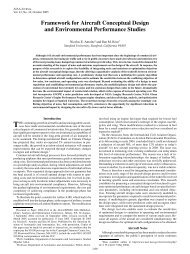
FIGURE 6.17 Predicted <strong>and</strong> experimental power required <strong>for</strong> the four-blade 2.5cm diameter<br />
rotor.<br />
Another key point of interest is the large amount of power required by the Sample-1 <strong>and</strong><br />
Sample-2 rotors, particularly apparent in the 40,000 to 50,000 RPM range, while the<br />
aluminum <strong>and</strong> Sample-4 rotors are very consistent with each other <strong>and</strong> the two analysis<br />
predictions. Sample-2 does exhibit additional thrust in this region, but Sample-1 does<br />
not <strong>and</strong> simply requires more power <strong>for</strong> a given amount of thrust.<br />
It is important to stress that variations between the rapid analysis prediction <strong>and</strong><br />
experiment discussed here are less than 10% to 15% in power required, typically less<br />
than 5% to 10% in thrust. This is adequate <strong>for</strong> preliminary design <strong>and</strong> feasibility studies<br />
<strong>and</strong> demonstrates the value of this tool. The following sections investigate the sources of