REGISTRATION DOCUMENT AND FINANCIAL REPORT - Iliad
REGISTRATION DOCUMENT AND FINANCIAL REPORT - Iliad
REGISTRATION DOCUMENT AND FINANCIAL REPORT - Iliad
- TAGS
- registration
- iliad
- iliad.fr

You also want an ePaper? Increase the reach of your titles
YUMPU automatically turns print PDFs into web optimized ePapers that Google loves.
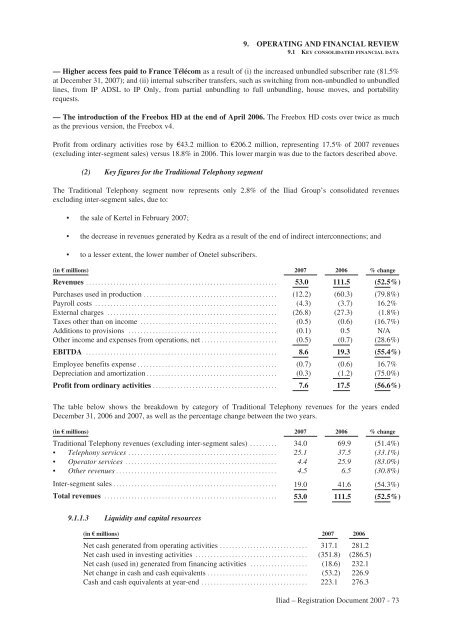
9. OPERATING <strong>AND</strong> <strong>FINANCIAL</strong> REVIEW<br />
9.1 KEY CONSOLIDATED <strong>FINANCIAL</strong> DATA<br />
— Higher access fees paid to France Télécom as a result of (i) the increased unbundled subscriber rate (81.5%<br />
at December 31, 2007); and (ii) internal subscriber transfers, such as switching from non-unbundled to unbundled<br />
lines, from IP ADSL to IP Only, from partial unbundling to full unbundling, house moves, and portability<br />
requests.<br />
— The introduction of the Freebox HD at the end of April 2006. The Freebox HD costs over twice as much<br />
as the previous version, the Freebox v4.<br />
Profit from ordinary activities rose by €43.2 million to €206.2 million, representing 17.5% of 2007 revenues<br />
(excluding inter-segment sales) versus 18.8% in 2006. This lower margin was due to the factors described above.<br />
(2) Key figures for the Traditional Telephony segment<br />
The Traditional Telephony segment now represents only 2.8% of the <strong>Iliad</strong> Group’s consolidated revenues<br />
excluding inter-segment sales, due to:<br />
• the sale of Kertel in February 2007;<br />
• the decrease in revenues generated by Kedra as a result of the end of indirect interconnections; and<br />
• to a lesser extent, the lower number of Onetel subscribers.<br />
(in € millions) 2007 2006 % change<br />
Revenues ............................................................... 53.0 111.5 (52.5%)<br />
Purchases used in production ............................................ (12.2) (60.3) (79.8%)<br />
Payroll costs ............................................................ (4.3) (3.7) 16.2%<br />
External charges ........................................................ (26.8) (27.3) (1.8%)<br />
Taxes other than on income ............................................. (0.5) (0.6) (16.7%)<br />
Additions to provisions ................................................. (0.1) 0.5 N/A<br />
Other income and expenses from operations, net ......................... (0.5) (0.7) (28.6%)<br />
EBITDA ............................................................... 8.6 19.3 (55.4%)<br />
Employee benefits expense .............................................. (0.7) (0.6) 16.7%<br />
Depreciation and amortization ........................................... (0.3) (1.2) (75.0%)<br />
Profit from ordinary activities ......................................... 7.6 17.5 (56.6%)<br />
The table below shows the breakdown by category of Traditional Telephony revenues for the years ended<br />
December 31, 2006 and 2007, as well as the percentage change between the two years.<br />
(in € millions) 2007 2006 % change<br />
Traditional Telephony revenues (excluding inter-segment sales) ......... 34.0 69.9 (51.4%)<br />
• Telephony services ................................................. 25.1 37.5 (33.1%)<br />
• Operator services .................................................. 4.4 25.9 (83.0%)<br />
• Other revenues ..................................................... 4.5 6.5 (30.8%)<br />
Inter-segment sales ...................................................... 19.0 41.6 (54.3%)<br />
Total revenues ......................................................... 53.0 111.5 (52.5%)<br />
9.1.1.3 Liquidity and capital resources<br />
(in € millions) 2007 2006<br />
Net cash generated from operating activities ............................. 317.1 281.2<br />
Net cash used in investing activities ..................................... (351.8) (286.5)<br />
Net cash (used in) generated from financing activities ................... (18.6) 232.1<br />
Net change in cash and cash equivalents ................................. (53.2) 226.9<br />
Cash and cash equivalents at year-end ................................... 223.1 276.3<br />
<strong>Iliad</strong> – Registration Document 2007 - 73