- Page 2 and 3:
HISTORIA DE PUERTO SERRANOPUERTO SE
- Page 4:
HISTORIA DE PUERTO SERRANOPUERTO SE
- Page 7 and 8:
1.1. Crecimiento poblacional ......
- Page 9 and 10: 4. El pacto en funcionamiento: la a
- Page 11 and 12: 4. Los que van a la guerra: la cami
- Page 13 and 14: 5. Erradicación del analfabetismo
- Page 15 and 16: VI-1. El voto censitario en Puerto
- Page 17 and 18: Índice de gráficosIII-1. La pobla
- Page 19 and 20: CEDA: Confederación Española de D
- Page 22 and 23: La historiografía suele señalar e
- Page 24 and 25: Nuestra investigación parte de la
- Page 26 and 27: Civil fueron en su mayor parte docu
- Page 28: I. La independencia municipal
- Page 32: II. Litigio por el término
- Page 35 and 36: La erección de Puerto Serrano en m
- Page 37 and 38: primer obstáculo no lo puso Morón
- Page 39 and 40: El deslinde y amojonamiento comenz
- Page 41 and 42: un todo a su opinión y a la genera
- Page 43 and 44: año de 1846 o cuarenta y siete y h
- Page 45 and 46: embargados en los procedimientos ad
- Page 47 and 48: ingresos que dejó de percibir dura
- Page 49 and 50: El diputado radical Manuel Moreno M
- Page 51 and 52: PLANO DEL TÉRMINO MUNICIPAL. DURAN
- Page 54 and 55: 1. La población1.1. Crecimiento po
- Page 56: Cuadro III-2Crecimiento demográfic
- Page 59: elaciones afectivas en la pareja so
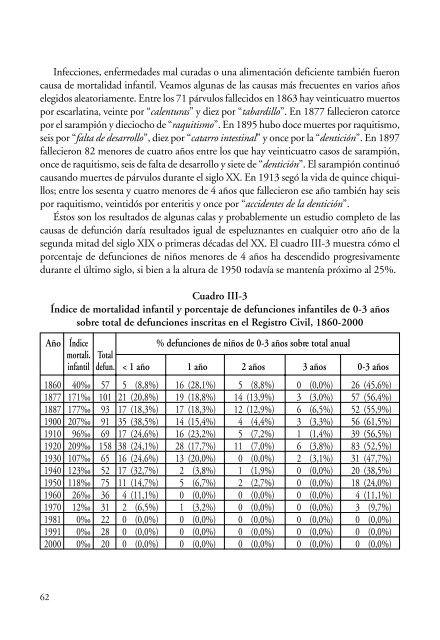
- Page 63 and 64: tos en el gráfico III-3, que sí n
- Page 65 and 66: Cuadro III-4Crecimiento intercensal
- Page 68 and 69: 2. Economía y sociedad2.1. Una soc
- Page 70 and 71: iamente y destinaron a la siembra d
- Page 72 and 73: Los tres primeros puestos del ranki
- Page 74 and 75: 2.3. Aprovechamiento agrícola del
- Page 76 and 77: Cuadro III-10Exportaciones de Puert
- Page 78 and 79: Cuadro III-11Contribuyentes por riq
- Page 80 and 81: UNA BODA DE LA CLASE MEDIA DE PUERT
- Page 82 and 83: En 1848 se decía que en el pueblo
- Page 84 and 85: con seis y las cuatro vías princip
- Page 86 and 87: PLANO DEL CASCO URBANO DE PUERTO SE
- Page 88 and 89: El número absolutoapenas habíades
- Page 90 and 91: io, pasillo, patio y cuadra para el
- Page 92 and 93: Calles estrechas sin previsión par
- Page 94 and 95: 3.5. Abastecimiento de aguas y sumi
- Page 96 and 97: Hubo que esperar hasta la década d
- Page 98 and 99: de enajenación del almacén de tri
- Page 100 and 101: No se dispuso de un local acondicio
- Page 102 and 103: alquilar en otros casos, también c
- Page 104 and 105: El mal estado de los caminos no era
- Page 106 and 107: habían solicitado la construcción
- Page 108 and 109: miento decía que el único medio n
- Page 110 and 111:
ar uno que se haga cargo de las can
- Page 112 and 113:
7º. Ninguno puede ejercer en los v
- Page 114 and 115:
Todo pues justifica que se le tenga
- Page 116:
CARTA DEL DIPUTADO SOCIALISTA ANTON
- Page 120 and 121:
El contexto de la independencia mun
- Page 122 and 123:
Cuadro IV-1Censo para la elección
- Page 124 and 125:
manifestando que un votante de la c
- Page 126 and 127:
La Ley Municipal moderada de 1845 r
- Page 128 and 129:
productores y comerciantes sólo te
- Page 130 and 131:
méritos, autonomía de la administ
- Page 132 and 133:
El Ayuntamiento calificó la de San
- Page 134 and 135:
particular”, y que otros habían
- Page 136 and 137:
“de un partido que ha organizado
- Page 138 and 139:
totalidad de votos en 1857 y 1858;
- Page 140 and 141:
9º. Se prohibe la estancia de cerd
- Page 142:
V. El Sexenio Revolucionario
- Page 145 and 146:
ló a la Unión Liberal en 1854, ri
- Page 147 and 148:
no dejaron de pagar el impuesto de
- Page 149 and 150:
finales de agosto se dispuso que el
- Page 151 and 152:
El gobernador militar de Cádiz dec
- Page 153 and 154:
mañana, que aparecieron tomadas to
- Page 155 and 156:
concejales. Acudid con confianza a
- Page 157 and 158:
la cuestión sobre la forma de Gobi
- Page 159 and 160:
El edicto del “ciudadano Juan Gar
- Page 162:
VI. La política de la Restauració
- Page 165 and 166:
1. Oligarquía y fraude electoralAn
- Page 167 and 168:
El turnismo es otra característica
- Page 169 and 170:
UNA FAMILIA CONSERVADORA. TODOS LOS
- Page 171 and 172:
sores José Moreno y Antonio Morale
- Page 173 and 174:
ción municipal, sino un fraude pac
- Page 175 and 176:
datos, asignándose 145 a uno y rep
- Page 177 and 178:
En el acta de votación y certifica
- Page 179 and 180:
1877 y 1890, pero el artículo 29 d
- Page 181 and 182:
DOCUMENTOProtesta de ilegalidad en
- Page 183 and 184:
Décima: Porque en vista de los abu
- Page 185 and 186:
La llegada de los liberales al gobi
- Page 187 and 188:
consumos en 1883 y 1884. La crispac
- Page 189 and 190:
La armonía se quebró a finales de
- Page 191 and 192:
Cuadro VI-10Ayuntamiento constituid
- Page 193 and 194:
3.4. Turno conservador: el negocio
- Page 195 and 196:
matadero y algunos, sabiendo que la
- Page 197 and 198:
El “ajuste de cuentas” con los
- Page 199 and 200:
Manuel Rodríguez Campos y Francisc
- Page 201 and 202:
Cuadro VI-13Elecciones municipales
- Page 203 and 204:
natural de Villaluenga, su familia
- Page 205 and 206:
encima de sus diferentes adscripcio
- Page 207 and 208:
LAS MUNICIPALES DE 12 DE NOVIEMBRE
- Page 209 and 210:
Cuadro VI-16Ayuntamientos constitui
- Page 211 and 212:
Cuadro VI-19Ayuntamiento constituid
- Page 213 and 214:
5. Crisis y ruptura del pacto (1912
- Page 215 and 216:
Antonio Maura por Eduardo Dato al f
- Page 217 and 218:
Los conservadores del entorno de lo
- Page 219 and 220:
fallo de la Comisión Provincial y
- Page 221 and 222:
Las protestas consiguieron que Mori
- Page 223 and 224:
disidente José Troya Domínguez, d
- Page 225 and 226:
AñoESPAÑAAlcaldePUERTO SERRANOCon
- Page 228:
VII. Desempleo y desarticulación d
- Page 231 and 232:
carácter de calamidadpública. Cri
- Page 233 and 234:
A principios de 1868 se recibió un
- Page 235 and 236:
Arahal. En Morón están tres. En V
- Page 237 and 238:
ción calificaba el empleo de foras
- Page 239 and 240:
escasas lluvias apenas aliviaron la
- Page 241 and 242:
obrero en la comarca.La “Sección
- Page 243 and 244:
io porque los propietarios de grano
- Page 245 and 246:
1902-1905, pero residió en Alcalá
- Page 247 and 248:
EN PUERTO SERRANO SE CONOCE LA CELE
- Page 250 and 251:
1. Regenerar la vida políticaEl go
- Page 252 and 253:
políticas de los últimos años de
- Page 254 and 255:
Puerto Serrano debemos señalar la
- Page 256 and 257:
de cajones en medio de la calle y P
- Page 258:
IX. La Segunda República (1931-193
- Page 261 and 262:
ción; también fueron miembros de
- Page 263 and 264:
JUAN SORIA VALDERRAMA, ALCALDE SOCI
- Page 265 and 266:
SELLO DE LA AGRUPACIÓN SOCIA-LISTA
- Page 267 and 268:
siones internas y reorganizar los c
- Page 269 and 270:
tosa” que padecían las familias
- Page 271 and 272:
cano Socialista está fuera de duda
- Page 273 and 274:
1.4. La derecha, contra el Ayuntami
- Page 275 and 276:
concluso a principios de 1933 el su
- Page 277 and 278:
de dicho señor, pues con ello cons
- Page 279 and 280:
SELLOS DE LA CNT DE PUERTO SERRANOD
- Page 281 and 282:
1.5.3. La Comisión de Policía Rur
- Page 283 and 284:
Cuadro IX-3Plan de labores de escar
- Page 285 and 286:
La petición de trabajar en las fin
- Page 287 and 288:
1.6. La Reforma Agraria 56El paro e
- Page 289 and 290:
Sin embargo debemos señalar dos ex
- Page 291 and 292:
1.8. Un pueblo en completo abandono
- Page 293 and 294:
Calculamos los nacidos no bautizado
- Page 295 and 296:
Cuadro IX-8Niños sin bautizar y en
- Page 297 and 298:
Cuadro IX-9Elecciones legislativas
- Page 299 and 300:
través de la Oficina de Colocació
- Page 301 and 302:
mía y otras ciencias. Además hab
- Page 303 and 304:
so mi deseo de que tenga los mayore
- Page 305 and 306:
El tiempo pareció darles la razón
- Page 307 and 308:
Todas las organizaciones de izquier
- Page 309 and 310:
2.5. Sin recursos económicosEl gra
- Page 311 and 312:
Serrano y ordenar que los guardias
- Page 313 and 314:
Gerardo Parra Coronado (IR), Manuel
- Page 315 and 316:
OCTAVILLA DE PROPAGANDA DEL FRENTE
- Page 317 and 318:
***DOCUMENTOPacto colectivo para el
- Page 320 and 321:
1. Golpe militar e institucionaliza
- Page 322 and 323:
desde 1938- responsable de la censu
- Page 324 and 325:
hablar del párroco de Villamartín
- Page 326 and 327:
Cuadro X-1Víctimas causadas por la
- Page 328 and 329:
Castellares desde el verano del añ
- Page 330 and 331:
Martel e Isabel Pérez García, jov
- Page 332 and 333:
* Juan Ruiz Nieto (a) Pistola Padre
- Page 334 and 335:
an movilizados: José García Carre
- Page 336 and 337:
5. Huérfanos, viudas y caballeros
- Page 338 and 339:
menzaron una “acalorada discusió
- Page 340 and 341:
tenía mejor concepto de los dos ca
- Page 342 and 343:
Cuadro X-5Huérfanos de guerra cens
- Page 344 and 345:
sión Provincial de Cádiz. Era sim
- Page 346 and 347:
SELLO DE LA FALANGE DE PUER-TO SERR
- Page 348 and 349:
EL ALCALDE JUAN GARCÍA VÁZQUEZ (C
- Page 350 and 351:
sucedió a Jerónimo como jefe del
- Page 352 and 353:
faltará; está bien que cuando no
- Page 354 and 355:
harina hasta finales de julio no es
- Page 356 and 357:
los oficiales. La carestía, la mal
- Page 358 and 359:
a la década, pero en agosto 1950 t
- Page 360 and 361:
9. La hacienda municipal9.1. “El
- Page 362 and 363:
EL PASEO DE LA CALLE RONDA Y LA CAS
- Page 364 and 365:
guardias valorado en 150.000 peseta
- Page 366 and 367:
Las dificultades para controlar el
- Page 368 and 369:
“El coste de la vida del obrero e
- Page 370 and 371:
Cuadro X-7Censo laboral de Puerto S
- Page 372 and 373:
la Virgen de laMacarena. La iniciat
- Page 374 and 375:
No parece que Puerto Serrano fuese
- Page 376 and 377:
UNA OCTAVILLA IMPRESA POR EL AYUNTA
- Page 378 and 379:
EL DESLINDE DE LOS TERRENOS DE LA C
- Page 380 and 381:
men del Gobierno Civil estaba influ
- Page 382 and 383:
los mismos obreros cuando tantos pa
- Page 384 and 385:
LOS CATÓLICOS DE PUERTO SERRANO VE
- Page 386 and 387:
TÓMBOLA ORGANIZADA POR CÁRITAS DE
- Page 388 and 389:
1960 para introducirseen la corpora
- Page 390:
XI. Puerto Serrano en democracia (1
- Page 393 and 394:
La ebullición política comenzó e
- Page 395 and 396:
1978 una concentración de jornaler
- Page 397 and 398:
Aunque García Poley hizo suya la r
- Page 399 and 400:
con Cristóbal Cadenas Mendoza en e
- Page 401 and 402:
te nominal. Los trabajadores del pu
- Page 403 and 404:
trales del sindicato y que moviliza
- Page 405 and 406:
abril de 1978. El PTA de Puerto Ser
- Page 407 and 408:
horas en protesta por la actitud de
- Page 409 and 410:
darizarse con ella 44 .El Gobierno
- Page 411 and 412:
en Villamartín y la segunda en Bor
- Page 413 and 414:
del PTA estaban en minoría, pero s
- Page 415 and 416:
esolver en el pueblo y que “al pr
- Page 417 and 418:
Cádiz manifestaba la posición má
- Page 419 and 420:
la oposición a Zarzuela, pero la e
- Page 421 and 422:
discutido muy pocas veces los probl
- Page 423 and 424:
gresivamente. El paro agrario estim
- Page 425 and 426:
TREINTA HERIDOS, VARIOS GRAVES, NUM
- Page 427 and 428:
LOS SUCESOS DE CUATRO MOJONES PROVO
- Page 429 and 430:
de la Diputación para librar fondo
- Page 431 and 432:
problema individual de conseguir la
- Page 433 and 434:
434ManifestaciónEn la cercana loca
- Page 435 and 436:
Fuego realVarios jornaleros, jóven
- Page 437 and 438:
Señor presidente: los pueblos y lo
- Page 439 and 440:
El 10 de diciembre de 1983, como ac
- Page 441 and 442:
EN VARIAS OCASIONES A LO LARGODEL S
- Page 443 and 444:
FRANCISCO SORIA, ALCALDE SOCIALISTA
- Page 445 and 446:
las comarcas. En la Sierra obtuvo o
- Page 447 and 448:
cuando la madrugada del 2 de julio
- Page 449 and 450:
PP volvió a presentar al concejal
- Page 451 and 452:
La paralización de la Reforma Agra
- Page 453 and 454:
dido, sin embargo, el empuje que tu
- Page 455 and 456:
Cuadro XI-5Elecciones al Congreso d
- Page 457 and 458:
Cuadro XI-8Ayuntamientos democráti
- Page 460:
XII. Crecimiento y desarrollo
- Page 463 and 464:
LA FUENTE DE LA CALLE RONDA TRAS LA
- Page 465 and 466:
LA ESTACIÓN DEL FERROCARRIL JEREZ-
- Page 467 and 468:
Transformar esa realidad socioecon
- Page 469 and 470:
INSTALACIONES DE LA PLANTA ENVASADO
- Page 472 and 473:
1. Fundación de la escuela de Puer
- Page 474 and 475:
DOCUMENTOContrato del maestro de la
- Page 476 and 477:
2. Deficiencias de la instrucción
- Page 478 and 479:
La insistencia en la necesidad de e
- Page 480 and 481:
hubo que esperar al año 1961 para
- Page 482 and 483:
3. De la falta de escuelas a la “
- Page 484 and 485:
de hacerlos asistir fueron inútile
- Page 486 and 487:
Arcos, Bornos, El Gastor, Espera, O
- Page 488 and 489:
mente inferior, 5,8%, por no habers
- Page 490 and 491:
Cuadro XIII-4Nivel de instrucción
- Page 492 and 493:
Bibliografía
- Page 494 and 495:
ALMAGRO M. DE OCA, G. (2001): Alcal
- Page 496 and 497:
CARO CANCELA, D. (1993): «Implanta
- Page 498 and 499:
ESPIGADO TOCINO, G. (1994): “La P
- Page 500 and 501:
INSTITUTO NACIONAL DE ESTADÍSTICA
- Page 502 and 503:
MORENO GÓMEZ, F. (1999): “El ter
- Page 504 and 505:
ROMERO ROMERO, F. (2002 c): “Fran