

1957 - United Nations Statistics Division
1957 - United Nations Statistics Division
1957 - United Nations Statistics Division

You also want an ePaper? Increase the reach of your titles
YUMPU automatically turns print PDFs into web optimized ePapers that Google loves.
CHAPTER I. FACTORS IN DECLINING MORTALITY<br />
The reduction achieved in mortality during the last<br />
several decades is by now a well-known phenomenon. So<br />
far as can be determined by available statistics, these<br />
trends have been world-wide in scope. Moreover, it appears<br />
that the dramatic declines in the death rate which<br />
some of the so-called "underdeveloped areas" have experienced<br />
have no precedent in the history of mortality<br />
among the countries of the world which now enjoy the<br />
lowest rates. In view of these facts, it would appear useful<br />
to explore the geographic differentials in the observed<br />
decline, as well as those observed in characteristics such<br />
as sex, age, and cause of death.<br />
WORLD DEMOGRAPHIC SITUATION<br />
Since the effects of the world-wide declines in mortality<br />
are reflected in the current demographic status of the<br />
world, it would be advantageous to begin the differential<br />
analysis with a review of the present situation.<br />
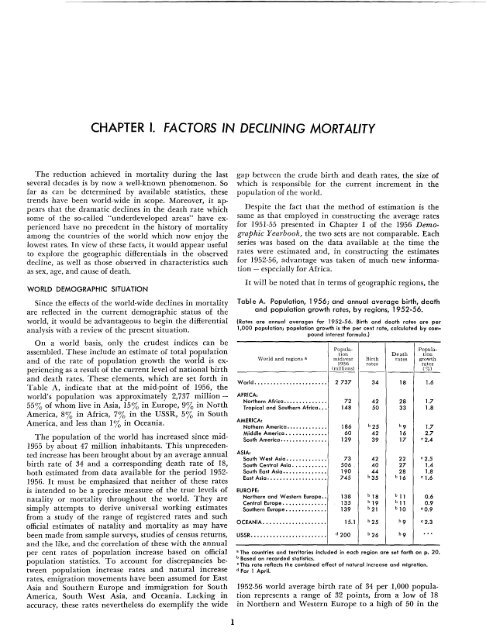
On a world basis, only the crudest indices can be<br />
assembled. These include an estimate of total population<br />
and of the rate of population growth the world is experiencing<br />
as a result of the current level of national birth<br />
and death rates. These elements, which are set forth in<br />
Table A, indicate that at the mid-point of 1956, the<br />
world's population was approximately 2,737 million<br />
55% of whom live in Asia, 15% in Europe, 9% in North<br />
America, 8% in Africa, 7% in the USSR, 5% in South<br />
America, and less than 1% in Oceania.<br />
The population of the world has increased since mid<br />
1955 by about 47 million inhabitants. This unprecedented<br />
increase has been brought about by an average annual<br />
birth rate of 34 and a corresponding death rate of 18,<br />
both estimated from data available for the period 1952<br />
1956. It must be emphasized that neither of these rates<br />
is intended to be a precise measure of the true levels of<br />
natality or mortality throughout the world. They are<br />
simply attempts to derive universal working estimates<br />
from a study of the range of registered rates and such<br />
official estimates of natality and mortality as may have<br />
been made from sample surveys, studies of census returns,<br />
and the like, and the correlation of these with the annual<br />
per cent rates of population increase based on official<br />
population statistics. To account for discrepancies between<br />
population increase rates and natural increase<br />
rates, emigration movements have been assumed for East<br />
Asia and Southern Europe and immigration for South<br />
America, South West Asia, and Oceania. Lacking in<br />
accuracy, these rates nevertheless do exemplify the wide<br />
1<br />
gap between the crude birth and death rates, the size of<br />
which is responsible for the current increment in the<br />
population of the world.<br />
Despite the fact that the method of estimation is the<br />
same as that employed in constructing the average rates<br />
for 1951-55 presented in Chapter I of the 1956 Demographic<br />
Yearbook, the two sets are not comparable. Each<br />
series was based on the data available at the time the<br />
rates were estimated and, in constructing the estimates<br />
for 1952-56, advantage was taken of much new information<br />
- especially for Africa.<br />
It will be noted that in terms of geographic regions, the<br />
Tabl eA. Population, 1956; and annual average birth, death<br />
and population growth rates, by regions, 1952-56.<br />
(Rates are annual overages for 1952-56. Birth and death rates are per<br />
1,000 population; population growth is the per cent rate, calculated by compound<br />
interest formula.)<br />
Popula- Population<br />
Death tian<br />
\Vorld and regions a midyear Birth rates growth<br />
1956 rates rates<br />
(millions) (%)<br />
World •••••.••••••••••••••••• 2737 34 18 1.6<br />
AFRICA:<br />
Northern Africa•••••••••••••. 72 42 28 1.7<br />
Tropical and Southern Africa ••• 148 50 33 1.8<br />
AMERICA:<br />
Nothern America ••••••••••••• 186 b 25 b9 1.7<br />
Middle America ••••••••••••• 60 42 16 2.7<br />
South America............... 129 39 17 02.4<br />
ASIA:<br />
South West Asia ••••••••••••• 73 42 22 02.5<br />
South Central Asia .••.••••••• 506 40 27 1.4<br />
South East Asia •••••••••••••• 190 44 28 1.8<br />
East Asia •••.•••••••••.•••.• 745 b 35 b16 01.6<br />
EUROPE:<br />
Northern and Western Europe •• 138 b 18 b 11 0.6<br />
Central Europe .••••••••••••• 135 b19 b 11 0.9<br />
Southern Europe ••••••••••••. 139 b 21 b 10 00.9<br />
OCEANIA.••••••••••••••••••• 15.1 b 25 b9 02.3<br />
USSR........................ d 200 b 26 b9 ...<br />
a The countries and territories included in each region are set forth on p. 20.<br />
b Based on recorded statistics.<br />
C This rate reflects the combined effect of natural increase and migration.<br />
d For 1 April.<br />
1952-56 world average birth rate of 34 per 1,000 population<br />
represents a range of 32 points, from a low of 18<br />
in Northern and Western Europe to a high of 50 in the


