

1957 - United Nations Statistics Division
1957 - United Nations Statistics Division
1957 - United Nations Statistics Division

You also want an ePaper? Increase the reach of your titles
YUMPU automatically turns print PDFs into web optimized ePapers that Google loves.
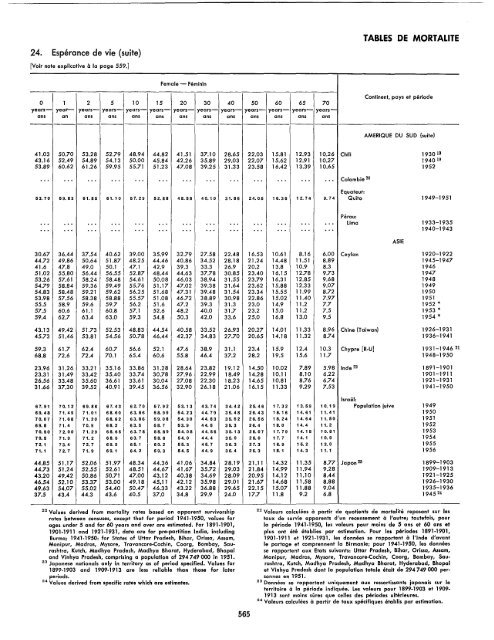
24. Esperance de vie (suite)<br />
[Voir note explicative a la page 559.]<br />
Female - Feminin<br />
0 1 2 5 10 15 20 30 40 50 60 65 70<br />
years- year--- years- years- years- years- years- years- years- years- years- years- yearsans<br />
an ans ans ans ans ans ans ans ans ans ans ans<br />
------------------------------------<br />
TABLES DE MORTALITE<br />
Continent, pays et periode<br />
AMERIQUE DU SUD {suite}<br />
41.03 50.70 53.28 52.79 48.94 44.82 41.51 37.10 28.65 22.03 15.81 12.93 10.26 Chili 1930 19<br />
43.16 52.49 54.89 54.13 50.00 45.84 42.26 35.89 29.03 22.07 15.62 12.91 10.27 1940 19<br />
53.89 60.62 61.26 59.95 55.71 51.23 47.08 39.25 31.33 23.58 16.42 13.39 10.65 1952<br />
.. , ., . ... ... ... ... ... .. . .. . ... ... ... ... Colombie 20<br />
Equateur:<br />
53.70 59.83 61.85 61.10 57.29 52.88 48.58 40.10 31.86 24.05 16.36 12.74 9.74 Quito 1949-1951<br />
Perou:<br />
.. . ... ... ... ... ... ... ... .. . ... ... ... ... Lima 1933-1935<br />
.. . ... .. . ... ... ... ... .. . ... ... ... ... ., . 1940-1943<br />
30.67 36.44 37.54 40.62 39.00 35.99 32.79 27.58 22.48 16.53 10.61 8.16 6.00 Ceylan 1920-1922<br />
44.72 49.86 50.64 51.87 48.25 44.46 40.86 34.52 28.18 21.24 14.48 11.51 8.89 1945-1947<br />
41.6 47.8 49.0 50.1 47.1 42.9 39.3 33.3 26.9 20.2 13.8 10.9 8.3 1946<br />
51.02 55.80 56.44 56.55 52.87 48.44 44.63 37.78 30.85 23.40 16.15 12.78 9.73 1947<br />
53.26 57.61 58.24 58.48 54.61 50.08 46.03 38.94 31.55 23.79 16.31 12.85 9.68 1948<br />
54.79 58.84 59.36 59.49 55.76 51.17 47.02 39.38 31.64 23.62 15.88 12.33 9.07 1949<br />
54.83 58.48 59.21 59.62 56.25 51.68 47.31 39.48 31.54 23.34 15.55 11.99 8.72 1950<br />
53.98 57.56 58.38 58.88 55.57 51.08 46.72 38.89 30.98 22.86 15.02 11.40 7.97 1951<br />
55.5 58.9 59.6 59.7 56.2 51.6 47.2 39.3 31.3 23.0 14.9 11.2 7.7 1952 *<br />
57.5 60.6 61.1 60.8 57.1 52.6 48.2 40.0 31.7 23.2 15.0 11.2 7.5 1953 *<br />
59.4 62.7 63.4 63.0 59.3 54.8 50.3 42.0 33.6 25.0 16.8 13.0 9.5 1954 *<br />
43.13 49.42 51.73 52.53 48.83 44.54 40.58 33.52 26.93 20.27 14.01 11.33 8.96 Chine {Taiwan} 1926-1931<br />
45.73 51.46 53.81 54.56 50.78 46.44 42.37 34.83 27.70 20.65 14.18 11.32 8.74 1936-1941<br />
59.3 61.7 62.4 60.7 56.6 52.1 47.6 38.9 31.1 23.4 15.9 12.4 10.3 Chypre [R-U] 1931-1946 21<br />
68.8 72.6 72.4 70.1 65.4 60.6 55.8 46.4 37.2 28.2 19.5 15.6 11.7 1948-1950<br />
23.96 31.26 33.21 35.16 33.86 31.28 28.64 23.82 19.12 14.50 10.02 7.89 5.98 Inde 22 1891-1901<br />
23.31 31.49 33.42 35.40 33.74 30.78 27.96 22.99 18.49 14.28 10.11 8.10 6.22 1901-1911<br />
26.56 33.48 35.60 36.61 33.61 30.04 27.08 22.30 18.23 14.65 10.81 8.76 6.74 1921-1931<br />
31.66 37.30 39.52 40.91 39.45 36.56 32.90 26.18 21.06 16.15 11.33 9.29 7.53 1941-1950<br />
Israel:<br />
67.91 70.12 69.86 67.43 62.70 57.92 53.13 43.74 34.42 25.46 17.32 13.69 10.19 Population juive 1949<br />
69.48 71.49 71.01 68.60 63.86 58.99 54.23 44.79 35.48 26.43 18.16 14.61 11.41 1950<br />
70.07 71.68 71.20 68.62 63.86 59.08 54.30 44.83 35.62 26.66 18.24 14.64 11.50 1951<br />
69.8 71.4 70.9 68.2 63.5 58.7 53.9 44.5 35.3 26.4 18.0 14.4 11.2 1952<br />
70.50 72.00 71.29 68.65 63.78 58.89 54.08 44.56 35.13 26.07 17.79 14.15 10.81 1953<br />
70.5 71.9 71.2 68.5 63.7 58.8 54.0 44.4 35.0 26.0 17.7 14.1 10.9 1954<br />
72.1 73.4 72.7 69.9 65.1 60.2 65.3 45.7 36.3 27.3 18.9 15.2 12.0 1955<br />
71.1 72.7 71.9 69.1 64.2 59.3 64.5 44.9 35.4 26.3 18.1 14.3 11.1 1956<br />
44.85 51.17 52.06 51.97 48.34 44.36 41.06 34.84 28.19 21.11 14.32 11.35 8.77 Japan 23 1899-1903<br />
44.73 51.24 52.55 52.61 48.51 44.67 41.67 35.72 29.03 21.84 14.99 11.94 9.28 1909-1913<br />
43.20 49.42 50.86 50.71 47.00 43.12 40.38 34.69 28.09 20.95 14.12 11.10 8.44 1921-1925<br />
46.54 52.10 53.37 53.00 49.18 45.11 42.12 35.98 29.01 21.67 14.68 11.58 8.88 1926-1930<br />
49.63 54.07 55.02 54.40 50.47 46.33 43.22 36.88 29.65 22.15 15.07 11.88 9.04 1935-1936<br />
37.5 43.4 44.3 43.6 40.5 37.0 34.8 29.9 24.0 17.7 11.8 9.2 6.8 1945 24<br />
22 Values derived fram mortality rates based on apparent survivorship<br />
rotes between censuses, except that for period 1941-1950, values for<br />
ages under 5 and for 60 years and over are estimated. For 1891-1901,<br />
1901.1911 and 1921-1931, data are far pre-partition India, including<br />
Burma; 1941-1950: for States of Uttar Pradesh, Bihar, Orissa, Assam,<br />
Manipur, Madras, Mysore, Travancore-Cochin, Coorg, Bombay, Saurashtra,<br />
Kutch, Madhya Pradesh, Madhya Bharat, Hyderabad, Bhopal<br />
and Vinhya Pradesh, comprising a population of 294749 000 in 1951.<br />
23 Japanese nationals only in territory as of period specified. Values far<br />
1899-1903 and 1909-1913 are less reliable than those for later<br />
pe"iods.<br />
24 Values derived from specific rates which are estimates.<br />
565<br />
ASIE<br />
22 Valeurs calculees a partir de quotients de mortalite reposant sur les<br />
faux de survie apparents d/un recensement a I'autre; toutefois, pour<br />
la periode 1941.1950, les valeurs pour moins de 5 ans et 60 ans et<br />
plus ant ete etablies par estimation. Pour les periodes 1891-1901,<br />
1901-1911 et 1921-1931, les donnees se rapportent a l'lnde d'avont<br />
Ie partage et comprennent la Birmanie; pour 1941-1950, les donnees<br />
se rapportent aux 'Etats suivants: Uttar Pradesh, Bihar, Orissa, Assam,<br />
Manipur, Madras, Mysore, Travancore-Cochin, Coorg, Bombay, Saurashtra,<br />
Kutch, Madhya Pradesh, Madhya Bharat, Hyderabad, Bhopal<br />
et Vinhya Pradesh dont la population totale etaH de 294749000 personnes<br />
en 1951.<br />
23 Donnees se rapportant uniquement aux ressortissants iaponais sur Ie<br />
territoire a la periode indiquee. Les valeurs pour 1899.1903 et 1909·<br />
1913 sont moins sures que celles des periodes ulterieures.<br />
24 Valeurs calculees a partir de taux specifiques etablis par estimation.


