

1957 - United Nations Statistics Division
1957 - United Nations Statistics Division
1957 - United Nations Statistics Division

Create successful ePaper yourself
Turn your PDF publications into a flip-book with our unique Google optimized e-Paper software.
year of 1.0 per 1,000 births for males and 0.8 per 1,000<br />
for females. Post-neo-natal mortality (1-11 months)<br />
showed a net annual decline of 1.9 for males and 1.5 for<br />
females. These figures confirm the impression that neonatal<br />
mortality has probably reached almost a minimum<br />
level under present circumstances in countries of low<br />
over-all infant mortality and is becoming more difficult<br />
to reduce. To decrease it still further, that is, to approach<br />
the success achieved in saving lives in early infancy, appears<br />
to demand new techniques.<br />
Mortality past infancy<br />
The inadequacies of the crude death rate for analysing<br />
changes in mortality have been set forth on p. 2. It was<br />
also noted in that section that according to the crude<br />
death rate, mortality had declined in all parts of the<br />
world - especially during the last decade - and appears<br />
to be continuing to decrease. To see whether these declines<br />
occurred throughout the age span or whether they<br />
reflect a combination of increasing mortality at some ages<br />
and decreases at others, the age specific death rates from<br />
Table 11 (p. 288) have been studied; these are the deaths<br />
in each age group per 1,000 population of the same age.<br />
First, it must be emphasized that age specific death rates<br />
are available for far fewer countries than are the crude<br />
rates. <strong>Statistics</strong> of deaths classified by age, together with<br />
a corresponding population for computing the specific<br />
rates, are not so widely available as are the total deaths<br />
and population. Further, to study a change over time,<br />
two sets of rates are required, separated by at least 5<br />
years. Rates by age for a year around 1948 and also for a<br />
current year are available for a maximum of 29 population<br />
groups and, with the exception of China (Taiwan),<br />
Japan, Israel, and Cyprus, these refer to countries of<br />
Europe, North America, and Oceania. For this reason,<br />
the following analysis of age as a factor in declining<br />
mortality cannot be interpreted on an international basis.<br />
It reflects only the experience of this rather limited group<br />
of areas for which data are available.<br />
To get an over-all picture of what has occurred during<br />
the past decade at each age group, the arithmetic mean<br />
of the age-specific death rates for a group of countries<br />
has been computed for the latest year (1955 or 1956)<br />
and for the earlier period (1948 or 1949). These means<br />
refer to different numbers of countries, ranging from 17<br />
which had rates for age 80-84 to 29 with rates for age<br />
groups 5-9 and 10-14. The mean rates are set forth in<br />
Table F.<br />
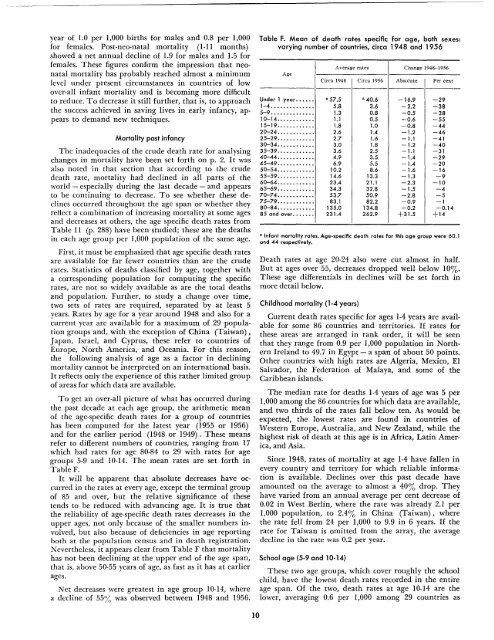
It will be apparent that absolute decreases have occurred<br />
in the rates at every age, except the terminal group<br />
of 85 and over, but the relative significance of these<br />
tends to be reduced with advancing age. It is true that<br />
the reliability of age-specific death rates decreases in the<br />
upper ages, not only because of the smaller numbers involved,<br />
but also because of deficiencies in age reporting<br />
both at the population census and in death registration.<br />
Nevertheless, it appears clear from Table F that mortality<br />
has not been declining at the upper end of the age span,<br />
that is, above 50-55 years of age, as fast as it has at earlier<br />
ages.<br />
Net decreases were greatest in age group 10-14, where<br />
a decline of 55% was observed between 1948 and 1956.<br />
10<br />
Table F. Mean of death rates specific for age, both sexes:<br />
varying number of countries, circa 1948 and 1956<br />
Age<br />
Average rates Change 1948-1956<br />
Circa 1948 Circa 1956 Absolute Per cent<br />
-----<br />
Under 1 year•••••• "57.5 "40.6 -16.9 -29<br />
1-4.............. 5.8 3.6 -2.2 -38<br />
5-9.............. 1.3 0.8 -0.5 -38<br />
10-14............ 1.1 0.5 -0.6 -55<br />
15-19............ 1.8 1.0 -0.8 -44<br />
20-24............ 2.6 1.4 -1.2 -46<br />
25-29............ 2.7 1.6 -1.1 -41<br />
30-34............ 3.0 1.8 -1.2 -40<br />
35-39.......•.... 3.6 2.5 -1.1 -31<br />
40-44............ 4.9 3.5 -1.4 -29<br />
45-49............ 6.9 5.5 -1.4 -20<br />
50-54............ 10.2 8.6 -1.6 -16<br />
55-59............ 14.6 13.3 -1.3 -9<br />
60-64............ 23.4 21.1 -2.3 -10<br />
65-69............ 34.3 32.8 -1.5 -4<br />
70-74............ 53.7 50.9 -2.8 -5<br />
75-79............ 83.1 82.2 -0.9 -1<br />
80-84............ 135.0 134.8 -0.2 -0.14<br />
85 and over••••••. 231.4 262.9 +31.5 +14<br />
" Infant mortality rotes. Age-speciAc death rates for this age group were 60.1<br />
and 44 respectively.<br />
Death rates at age 20-24 also were cut almost in half.<br />
But at ages over 55, decreases dropped well below 10%.<br />
These age differentials in declines will be set forth in<br />
more detail below.<br />
Childhood mortality (1-4 years)<br />
Current death rates specific for ages 1-4 years are available<br />
for some 86 countries and territories. If rates for<br />
these areas are arranged in rank order, it will be seen<br />
that they range from 0.9 per 1,000 population in Northern<br />
Ireland to 49.7 in Egypt - a span of about 50 points.<br />
Other countries with high rates are Algeria, Mexico, E1<br />
Salvador, the Federation of Malaya, and some of the<br />
Caribbean islands.<br />
The median rate for deaths 1-4 years of age was 5 per<br />
1,000 among the 86 countries for which data are available,<br />
and two thirds of the rates fall below ten. As would be<br />
expected, the lowest rates are found in countries of<br />
Western Europe, Australia, and New Zealand, while the<br />
highest risk of death at this age is in Africa, Latin America,<br />
and Asia.<br />
Since 1948, rates of mortality at age 1-4 have fallen in<br />
every country and territory for which reliable information<br />
is available. Declines over this past decade have<br />
amounted on the average to almost a 40% drop. They<br />
have varied from an annual average per cent decrease of<br />
0.02 in West Berlin, where the rate was already 2.1 per<br />
1,000 population, to 2.4% in China (Taiwan), where<br />
the rate fell from 24 per 1,000 to 9.9 in 6 years. If the<br />
rate for Taiwan is omitted from the array, the average<br />
decline in the rate was 0.2 per year.<br />
School age (5-9 and 10-14)<br />
These two age groups, which cover roughly the school<br />
child, have the lowest death rates recorded in the entire<br />
age span. Of the two, death rates at age 10-14 are the<br />
lower, averaging 0.6 per 1,000 among 29 countries as


