

1957 - United Nations Statistics Division
1957 - United Nations Statistics Division
1957 - United Nations Statistics Division

Create successful ePaper yourself
Turn your PDF publications into a flip-book with our unique Google optimized e-Paper software.
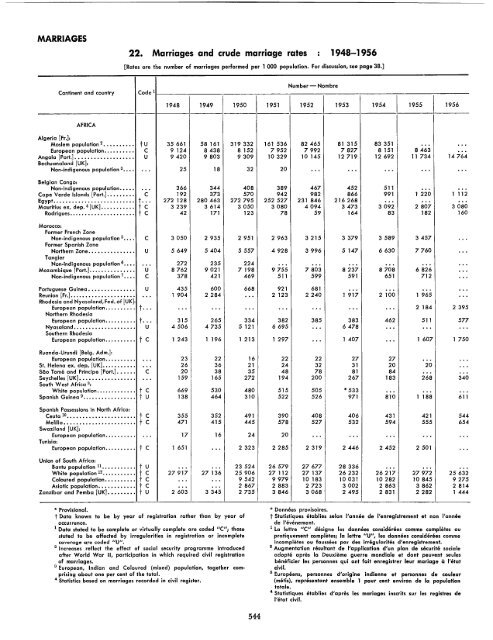
MARRIAGES<br />
Continent and country Code 1<br />
AFRICA<br />
22. Marriages and crude marriage rates 1948-1956<br />
[Rates are the number of marriages performed per 1 000 population. For discussion, see page 38.]<br />
Number - Nombre<br />
1948 1949 1950 1951 1952 1953 1954 1955 1956<br />
Algeria [Fr.]:<br />
Moslem population 2 •••••••••• tu 35661 58161 319332 161 536 82465 81 315 83351 ... ...<br />
European population•.•••••••• C 9124 8438 8152 7952 7992 7827 8151 8463 ...<br />
Angola [Por!.] .•••••••••••••••••. U 9420 9803 9309 10329 10145 12719 12692 11734 14764<br />
Bechuanaland [UK]:<br />
Non-indigenous population 3•••• .. . 25 18 32 20 ... ... ... ... ...<br />
Belgian Congo:<br />
Non-indigenous population.•••• ... 366 344 408 389 467 452 511 ... ...<br />
Cape Verde Islands [Por!.] .•••••••• C 192 373 570 942 982 866 991 1 220 1 112<br />
Egypt..•••••••••.•••....•..•••• t... 272 128 280463 272 795 252527 231 846 216268 ... ... ...<br />
Mauritius ex. dep.4 [UK] •.•••.•.••• t C 3239 3614 3050 3080 4094 3473 3092 2807 3080<br />
Rodrigues...•.••.••••.••••.••. t C 42 171 123 78 59 164 83 182 160<br />
Morocco:<br />
Former French Zone<br />
Non-indigenous population 5•••• C 3050 2935 2951 2963 3215 3379 3589 3457 ...<br />
Former Spanish Zone<br />
Northern Zone.•.•••••••••.•. U 5649 5404 5557 4928 3996 5147 6630 7760 ...<br />
Tangier<br />
Non.indigenous population 6•••• ... 272 235 224 ... ... '" ... ... ...<br />
Mozambique [Por!.] ......•.••••••• U 8762 9021 7198 9755 7803 8237 8708 6826 ...<br />
Non-indigenous population 7•••• C 378 421 469 511 599 591 651 712 ·..<br />
Portuguese Guinea ••••••.•••••.•. U 435 600 668 921 681 ... ... .. . ...<br />
Reunion [Fr.] •.•••••...•..•.•••••• .. . 1 904 2284 ... 2 123 2240 1 917 2 100 1 965 ...<br />
Rhodesia and Nyasaland, Fed. of [UK]:<br />
European population...•.•..•. too . ... ... .. . ... '" .. . ... 2 184 2395<br />
Northern Rhodesia<br />
European population•.••••••.. too. 315 265 334 382 385 383 462 511 577<br />
Nyasaland•..•••••••.•••••..•• U 4506 4735 5121 6695 ... 6478 ... ... ...<br />
Southern Rhodesia<br />
European population.•.•••.••. t C 1 243 1 196 1 213 1297 .. . 1407 ... 1 607 1750<br />
Ruanda-Urundi [Belg. Adm.]:<br />
European population•.•••••••• .. . 23 22 16 22 22 27 27 ... ·..<br />
St. Helena ex. dep. [UK]........... ... 26 36 21 24 32 31 20 20 ...<br />
Sao Tome and Principe [Port.] .••.•. C 20 38 35 48 78 81 84 ... ...<br />
Seychelles [UK] •..•••••••.•.•.••. ... 159 165 272 194 200 267 183 268 340<br />
South West Africa 8:<br />
White population....•.•.•.••• t C 669 530 480 515 505 * 533 ... ... ...<br />
Spanish Guinea 9••••••••••••••••• t U 138 464 310 522 526 971 810 1 188 611<br />
Spanish Possessions in North Africa:<br />
Ceuta 10•••••••••••••••••••••• t C 355 352 491 390 408 406 431 421 544<br />
Melilla •••••••.•.•••••••••••.• t C 471 415 445 578 527 532 594 555 654<br />
Swaziland [UK]:<br />
European population.•.•••.••. ... 17 16 24 20 ... ... '" '" ...<br />
Tunisia:<br />
European population•..•••.•.. t C 1 651 ... 2323 2285 2319 2446 2452 2501 ·..<br />
Union of South Africa:<br />
Bantu population 11 ••••••••••• t U .. . .. . 23524 26579 27677 28336 ... ... ...<br />
White population 12 ••••••••••• t C 27917 27136 25906 27112 27137 26232 26217 27972 25632<br />
Coloured population•••••••••• t C ... ... 9542 9979 10 183 10031 10282 10845 9275<br />
Asiatic population•••••••••••• t C .. . ... 2867 2883 2723 3002 2863 3862 2814<br />
Zanzibar and Pemba [UK] ••••••••. t U 2603 3345 2735 3846 3068 2495 2831 2282 1444<br />
* Provisional.<br />
t Data known to be by year of registration rather than by year of<br />
occurrence.<br />
1 Data stated to be complete or virtually complete are coded "C"; those<br />
stated to be affected by irregularities in registration or incomplete<br />
coverage Q_re coded "U".<br />
2 Increases reflect the effect of social security programme introduced<br />
after World War II, participation in which required civil registration<br />
of marriages.<br />
3 European, Indian and Coloured (mixed) population, together comprising<br />
about one per cent of the totaI.<br />
4 <strong>Statistics</strong> based on marriages recorded in civil register.<br />
544<br />
* Donnees provisoires.<br />
t Statistiques etablies selon I'annee de I'enregistrement et non I'annee<br />
de I'.;venement.<br />
1 La leltre "c" designe les donnees considerees comme completes ou<br />
pratiquement completes; la lettre "U", les donnees considerees comme<br />
incompletes ou faussees par des irregularib!s d'enregistrement.<br />
2 Augmentation resultant de I'application d'un plan de securite sociaIe<br />
adopte apres la Deuxieme guerre mondiale et dont peuvent seules<br />
beneficier les personnes qui ont fait enregistrer leur mariage a I'etat<br />
civil.<br />
3 Europeens, personnes d'origine indienne et personnes de couleur<br />
(metis), representant ensemble 1 pour cent environ de 10 population<br />
totale.<br />
4 Statistiques etablies d'apres les mariages inscrits sur les registres de<br />
I'etat civil.


