

1957 - United Nations Statistics Division
1957 - United Nations Statistics Division
1957 - United Nations Statistics Division

You also want an ePaper? Increase the reach of your titles
YUMPU automatically turns print PDFs into web optimized ePapers that Google loves.
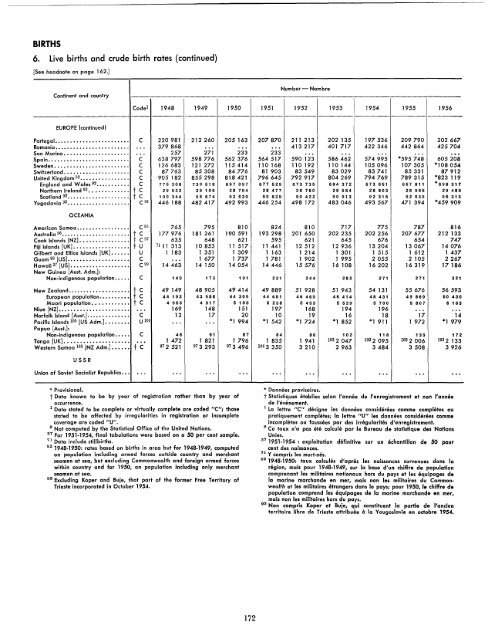
BIRTHS<br />
6. Live births and crude birth rates (continued)<br />
[See headnote on page 162.]<br />
Continent and country<br />
EUROPE (continued)<br />
Number - Nombre<br />
Code l 1948 1949 1950 1951 1952 1953 1954 1955 1956<br />
Portugal•••••••.•••••.•••••••••• C 220981 212260 205 163 207870 211 213 202 135 197536 209790 202667<br />
Romania .••••.•••.•••.•••••.••.. ... 379868 .. . .. . ... 413217 401717 422346 442864 425704<br />
San Marino••••••.....•.••••••.. .. . 257 271 233 233 ... ... ... ... ...<br />
Spain.••••••••••••.•••••••..••. C 638797 598776 562 376 564517 590 123 586462 574995 *595748 605208<br />
Sweden.•..•••••••••••••....... C 126683 121 272 115414 110168 110192 110144 105096 107305 *108054<br />
Switzerland..•...••..•.......... C 87763 85308 84776 81 903 83549 83029 83741 85331 87912<br />
<strong>United</strong> King dom 92.•..•..•........ C 905 182 855298 818421 796645 792917 804269 794769 789315 *823 119<br />
England and Wales 92•.•.••...•. C 775306 730518 697 097 677 529 673735 684372 673 651 667 811 *698317<br />
Northern Ireland 92•.••••.•.•.•. t C 29 532 29 106 28 794 28 477 28 760 28 984 28 803 28 965 29 489<br />
Scotland 92..•••••••••••....... t C 100 344 95 674 92 530 90 639 90 422 90 913 92 316 92 539 96 313<br />
Yugoslavia 93•••••..•.•.•...•.... C 94 446 188 482417 492993 446254 498172 483046 493567 471 394 *459909<br />
OCEANIA<br />
American Samoa•.•••••••••..•.•. C 95<br />
Australia 96.•.••.•.•.••..•...•.•. t C<br />
Cook Islands [NZ] ••••••.••.•.•.•. t C97<br />
Fiji Islands [UK] ...•........•...•• t U<br />
Gilbert and Ellice Islands [UK] •..•.• U<br />
Guam 98 [US] .•••••••••••••••.... C<br />
Hawaii 37 [US] ••••.•...••••••.•.. C 99<br />
New Guinea [Aust. Adm.]:<br />
765<br />
177976<br />
635<br />
71 11 313<br />
1 183<br />
...<br />
14463<br />
795<br />
181 261<br />
648<br />
10853<br />
1 351<br />
1 677<br />
14150<br />
810<br />
190591<br />
621<br />
11 517<br />
1 309<br />
1737<br />
14054<br />
824<br />
193298<br />
595<br />
11441<br />
1 163<br />
1 781<br />
14446<br />
810<br />
201 650<br />
621<br />
12512<br />
1 214<br />
1 902<br />
15576<br />
717<br />
202235<br />
645<br />
12936<br />
1 301<br />
1 995<br />
16108<br />
775<br />
202256<br />
676<br />
13204<br />
1 515<br />
2055<br />
16202<br />
787<br />
207677<br />
654<br />
13067<br />
1 612<br />
2105<br />
16319<br />
816<br />
212133<br />
747<br />
14076<br />
1437<br />
2267<br />
17186<br />
Non-indigenous population•••.. C 149 173 191 231 244 282 271 271 321<br />
New Zealand•.•......•.••.••••.. t C 49149 48905 49414 49889 51 928 51 943 54131 55676 56593<br />
European population.••••••••• t C 44 193 43 988 44 309 44 651 46 469 46 414 48 431 49 869 50 430<br />
Maori population•••••.•.•••• t C 4 956 4 917 5 105 5 238 5 459 5 529 5 700 5 807 6 163<br />
Niue [NZ] ••.•••••.•••••••••••••• ... 169 148 151 197 168 194 196 .. . ...<br />
Norfolk Island [Aust.] ..•••••••••••• C 13 17 20 10 19 16 18 17 14<br />
PociRc Islands 100 [US Adm.] •••••••• U101 ... ... *1 994 *1 542 *1 724 *1 852 *1 911 1 972 *1 979<br />
Papua [Aust.]:<br />
Non-indigenous population.•••• C 46 61 87 84 86 102 118 139 172<br />
Tonga [UK] •••••.••••••.•••••••• ... 1472 1 821 1796 1 835 1 941 102 2 047 102 2 095 102 2 006 102 2 133<br />
Western Samoa 103 [NZ Adm.] •••••• t C 97 2 521 97 3 293 97 3 496 104 3 350 3210 2963 3484 3508 3926<br />
USSR<br />
Union of Soviet Socialist Republics ••• .. . ... '" ... ... ... .. . ... ... '"<br />
* Provisionalt<br />
Data known to be by year of registration rather than by year of<br />
occurrence.<br />
1 Data stated to be complete or v,irtually complete are coded "C'; those<br />
stated to be affected by irregularities in registration or incomplete<br />
coverage are coded nu".<br />
S Not computed by the Statistical Office of the <strong>United</strong> <strong>Nations</strong>.<br />
37 For 1951-1954, final tabulations were based on a 50 per cent sample.<br />
71 Data include stillbirths.<br />
92 1948-1950: rates based on births in area but for 1948·1949, computed<br />
on population including armed forces outside country and merchant<br />
seamen at sea, but excluding Commonwealth and foreign armed forces<br />
within country and for 1950, on population ,including only merchant<br />
seamen at sea.<br />
93 Excluding Koper and Buje, that part of the former Free Territory of<br />
Trieste incorporated in October 1954.<br />
172<br />
* Donnees provisoires.<br />
t Statistiques etablies selon I'annee de I'enregistrement et non I'annee<br />
de I'evenement.<br />
1 La letlre "C" designe les donnees considerees comme completes ou<br />
pratiquement completes; la letlre "u" les donnees considerees COmme<br />
incompletes au faussees par des irregularites d'enregistrement.<br />
S Ce taux n'a pas ete calcule par Ie Bureau de statistique des <strong>Nations</strong><br />
Unies.<br />
37<br />
1951.1954 : exploitation definitive sur un echantillon de 50 pour<br />
cent des naissances.<br />
71 Y compris les mort-nes.<br />
92<br />
1948.1950: taux calcules d'apres les naissances survenues dans 10<br />
region, mais pour 1948·1949, sur la base d'un chiffre de population<br />
comprenant les militaires nationaux hors du pays et les equipages de<br />
la marine marchande en mer, mais non les militaires du Common·<br />
wealth et les militaires etrangers dans Ie pays; pour 1950, Ie chiffre de<br />
population comprend les equipages de 10 marine marchande en mer,<br />
rnais non les militaires hors du pays.<br />
93 Non compris Koper et Buje, qui constituent 10 partie de I'ancien<br />
territoire Iibre de Trieste atlribuee a la Yougoslavie en octobre 1954.


