

1957 - United Nations Statistics Division
1957 - United Nations Statistics Division
1957 - United Nations Statistics Division

Create successful ePaper yourself
Turn your PDF publications into a flip-book with our unique Google optimized e-Paper software.
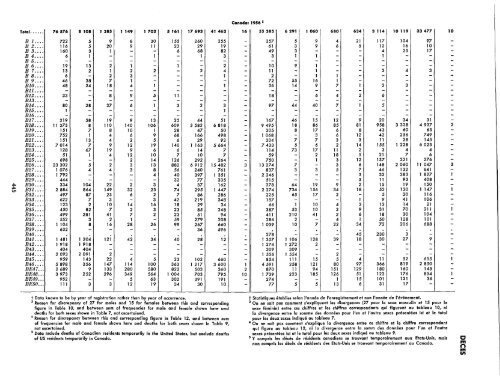
Canada: 1956 5<br />
Total. ...•. 76576 8 108 1 285 1 149 1702 5 161 17693 41462 16 55385 6291 1060 680 634 3 114 10119 33477 10<br />
B 1.... 722 5 9 8 30 155 260 255 - 357 5 9 4 21 117 104 97 -<br />
B 2.... 116 5 20 9 11 23 29 19 - 61 3 9 6 5 12 16 10 -<br />
B 3.... 160 3 I - - 6 68 82 - 49 3 - - - 4 25 17 -<br />
B 4.... 6 1 - - I - I 3 - 3 I I - - I - - -<br />
B 5.... - - - - - - - - - - - - - - - - - -<br />
B 6.... 19 13 2 I - 1 - 2 - 10 9 I - - - - - -<br />
B 7.... 13 2 I 2 2 - 2 4 - II - I - - 3 4 3 -<br />
B 8.... 6 - 2 3 - - - I - 2 - I I - - - - -<br />
B 9.... 46 38 7 I - - - - - 72 55 16 I - - - - -<br />
BlO.... 48 24 18 4 I - - 1 - 36 14 9 7 I 2 3 - -<br />
Bll.... - - - - - - - - - - - - - - - - - -<br />
BI2.... 33 - 8 9 5 II - - - 18 - 6 4 2 6 - - -<br />
BI3.... - - - - - - - - - - - - - - - - - -<br />
BI4• •.. 80 28 37 6 I 3 2 3 - 97 44 40 7 I 5 - - -<br />
Bl5.... I - - - - - - I - - - - - - - - - -<br />
BI6.... - - - - - - - - - - - - - - - - - -<br />
B17.... 219 58 19 9 13 25 44 51 - 167 46 15 12 9 20 34 31 -<br />
BI8.... II 373 8 110 140 106 609 3582 6818 - 9495 18 86 85 81 958 3328 4937 2<br />
BI9.... 151 7 8 10 I 28 47 50 - 205 8 17 6 8 43 60 63 -<br />
B20.... 752 I 4 6 9 68 166 498 - 1068 - 3 6 12 42 256 749 -<br />
B21. ... 151 13 4 2 5 6 29 92 - 204 7 7 3 3 11 28 145 -<br />
B22.... 7014 7 9 12 19 140 I 163 5664 - 7433 5 6 2 14 155 I 228 6023 -<br />
B23.... 128 67 19 9 6 6 14 7 - 114 73 17 II 2 3 4 4 -<br />
B24.... 51 I 4 12 10 7 10 7 - 59 - 2 18 5 21 7 6 -<br />
B25.... 698 - - 2 14 126 292 264 - 750 - I 3 12 137 321 276 -<br />
B26..•. 23302 5 2 3 13 882 6912 15482 3 13274 7 - 3 6 148 2060 II 047 3<br />
B27.... 1076 4 4 3 8 56 240 761 - 837 3 3 5 7 46 132 641 -<br />
B28.... 1792 - - - 4 40 397 I 351 - 2246 - - - 3 32 383 I 827 I<br />
B29..•. 444 - - - - 32 77 335 - 515 - - - 3 11 93 408 -<br />
B30.... 334 104 22 2 3 4 37 162 - 278 64 19 9 2 15 19 150 -<br />
B31. ... 2884 864 149 32 23 74 295 1447 - 2274 736 156 34 18 52 130 1 147 I<br />
B32.... 497 87 23 6 2 7 86 286 - 225 65 17 2 - 5 20 116 -<br />
B33.... 622 7 3 - 3 42 219 348 - 157 - - - I 9 41 106 -<br />
B34.... 123 2 10 14 16 18 29 34 - 66 I 10 4 3 13 14 21 -<br />
B35.... 450 82 7 2 3 23 85 248 - 387 53 10 2 9 31 70 211 I<br />
B36.... 499 281 41 7 2 23 51 94 - 411 210 41 2 6 18 30 104 -<br />
B37. ... 552 3 2 I - 59 279 208 - 286 2 - 4 I 50 128 101 -<br />
B38.... I 104 8 16 28 26 99 267 660 - I 039 10 7 22 34 72 206 688 -<br />
B39.... 632 - - - - - 36 596 -<br />
B40..•. 278 - - - 45 230 3 - -<br />
B4I .... I 481 1204 121 42 34 40 28 12 - I 357 I 106 128 39 18 30 27 9 -<br />
B42.... I 918 1918 - - - - - - - 1274 1272 2 - - - - - -<br />
B43.... 404 404 - - - - - - - 309 309 - - - - - - -<br />
B44.... 2093 2091 2 - - - - - - I 556 I 554 - 2 - - - - -<br />
B45.... 959 143 22 4 5 23 102 660 - 854 III 15 5 4 II 52 655 I<br />
B46.... 5898 356 147 114 100 363 I 217 3600 I 4591 258 121 80 97 366 819 2850 -<br />
BE47... 2689 9 133 280 580 822 503 360 2 870 11 94 151 129 180 160 145 -<br />
BE48... 3973 252 296 349 564 1004 703 795 10 1739 223 185 126 51 123 176 854 I<br />
BE49... 952 - - 5 63 302 391 191 - 274 - - I 15 101 121 36 -<br />
BE50... III 3 3 12 19 34 30 10 - 77 5 5 13 6 31 17 - -<br />
t Data known to be by year of registration rather than by year of occurrence.<br />
3 Reason for discrepancy of 27 for males and 15 for females between this and corresponding<br />
figure in Table 10, and between sum of frequencies for male and female shown here and<br />
deaths for bath sexes shown in Table 7, not ascertained.<br />
4 Reason for discrepancy between this and corresponding figure in Table 12, and between sum<br />
of frequencies for male and female shown here and deaths for both sexes shawn in Table 9,<br />
not ascertained.<br />
5 Data include deaths of Canadian residents temporarily in the <strong>United</strong> States, but exclude deaths<br />
of US residents temporarily in Canada.<br />
t Statistiques elablies selon l'an",3e de I'enregistrement et non I'annee de I'evenement.<br />
3 On ne sait pas comment s'expliquent les divergences (27 pour Ie sexe masculin et 15 pour Ie<br />
sexe feminin) entre ces chiffres et les chiffres correspondants qui figurent au tableau 10, ni<br />
la divergence entre la samme des donnees pour I'un et I'autre sexes presentees ici et Ie total<br />
pour les deux sexes indique au tableau 7.<br />
4 On ne sait pas comment s'explique 10 divergence entre ce chiffre et Ie chiffre correspandant<br />
qui figure au tableau 12, ni 10 divergence entre 10 somm des donnees pour I'un et I'autre<br />
sexes presentees ici et Ie total pour les deux sexes indique au tableau 9.<br />
5 Y campris les deces de residents canadiens se trouvant temporairement aux Etats-Unis, mais<br />
non compris les deces de residents des Etats-Unis se trouvant temporairement au Canada.<br />
C<br />
m<br />
n m<br />
CIt


