1957 - United Nations Statistics Division
1957 - United Nations Statistics Division
1957 - United Nations Statistics Division
You also want an ePaper? Increase the reach of your titles
YUMPU automatically turns print PDFs into web optimized ePapers that Google loves.
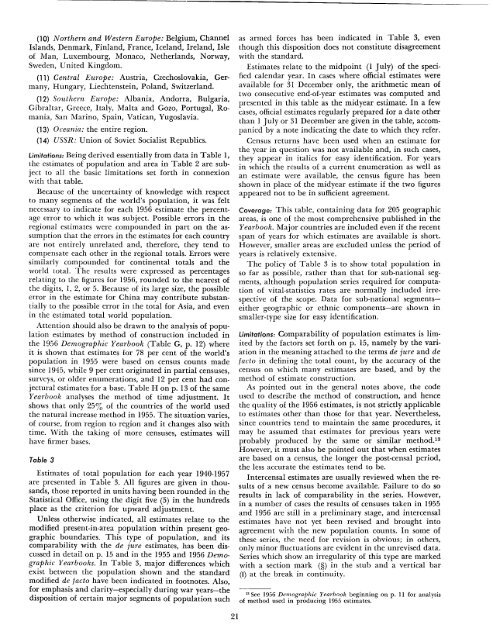
(10) Northern and Western Europe: Belgium, Channel<br />
Islands, Denmark, Finland, France, Iceland, Ireland, Isle<br />
of Man, Luxembourg, Monaco, Netherlands, Norway,<br />
Sweden, <strong>United</strong> Kingdom.<br />
(11) Central Europe: Austria, Czechoslovakia, Germany,<br />
Hungary, Liechtenstein, Poland, Switzerland.<br />
(12) Southern Europe: Albania, Andorra, Bulgaria,<br />
Gibraltar, Greece, Italy, Malta and Gozo, Portugal, Romania,<br />
San Marino, Spain, Vatican, Yugoslavia.<br />
(13) Oceania: the entire region.<br />
(14) USSR: Union of Soviet Socialist Republics.<br />
Limitations: Being derived essentially from data in Table 1,<br />
the estimates of population and area in Table 2 are subject<br />
to all the basic limitations set forth in connexion<br />
with that table.<br />
Because of the uncertainty of knowledge with respect<br />
to many segments of the world's population, it was felt<br />
necessary to indicate for each 1956 estimate the percentage<br />
error to which it was subject. Possible errors in the<br />
regional estimates were compounded in part on the assumption<br />
that the errors in the estimates for each country<br />
are not entirely unrelated and, therefore, they tend to<br />
compensate each other in the regional totals. Errors were<br />
similarly compounded for continental totals and the<br />
world total. The results were expressed as percentages<br />
relating to the figures for 1956, rounded to the nearest of<br />
the digits, 1, 2, or 5. Because of its large size, the possible<br />
error in the estimate for China may contribute substantially<br />
to the possible error in the total for Asia, and even<br />
in the estimated total world population.<br />
Attention should also be drawn to the analysis of population<br />
estimates by method of construction included in<br />
the 1956 Demographic Yearbook (Table G, p. 12) where<br />
it is shown that estimates for 78 per cent of the world's<br />
population in 1955 were based on census counts made<br />
since 1945, while 9 per cent originated in partial censuses,<br />
surveys, or older enumerations, and 12 per cent had conjectural<br />
estimates for a base. Table H on p. 13 of the same<br />
Yearbook analyses the method of time adjustment. It<br />
shows that only 25% of the countries of the world used<br />
the natural increase method in 1955. The situation varies,<br />
of course, from region to region and it changes also with<br />
time. With the taking of more censuses, estimates will<br />
have firmer bases.<br />
Table 3<br />
Estimates of total population for each year 1940-<strong>1957</strong><br />
are presented in Table 3. All figures are given in thousands,<br />
those reported in units having been rounded in the<br />
Statistical Office, using the digit five (5) in the hundreds<br />
place as the criterion for upward adjustment.<br />
Unless otherwise indicated, all estimates relate to the<br />
modified present-in-area population within present geographic<br />
boundaries. This type of population, and its<br />
comparability with the de jure estimates, has been discussed<br />
in detail on p. 15 and in the 1955 and 1956 Demographic<br />
Yearbooks. In Table 3, major differences which<br />
exist between the population shown and the standard<br />
modified de facto have been indicated in footnotes. Also,<br />
for emphasis and clarity-especially during war years-the<br />
disposition of certain major segments of population such<br />
21<br />
as armed forces has been indicated in Table 3, even<br />
though this disposition does not constitute disagreement<br />
with the standard.<br />
Estimates relate to the midpoint (I July) of the specified<br />
calendar year. In cases where official estimates were<br />
available for 31 December only, the arithmetic mean of<br />
two consecutive end-of-year estimates was computed and<br />
presented in this table as the midyear estimate. In a few<br />
cases, official estimates regularly prepared for a date other<br />
than 1 July or 31 December are given in the table, accompanied<br />
by a note indicating the date to which they refer.<br />
Census returns have been used when an estimate for<br />
the year in question was not available and, in such cases,<br />
they appear in italics for easy identification. For years<br />
in which the results of a current enumeration as well as<br />
an estimate were available, the census figure has been<br />
shown in place of the midyear estimate if the two figures<br />
appeared not to be in sufficient agreement.<br />
Coverage: This table, containing data for 205 geographic<br />
areas, is one of the most comprehensive published in the<br />
Yearbook. Major countries are included even if the recent<br />
span of years for which estimates are available is short.<br />
However, smaller areas are excluded unless the period of<br />
years is relatively extensive.<br />
The policy of Table 3 is to show total population in<br />
so far as possible, rather than that for sub-national segments,<br />
although population series required for computation<br />
of vital-statistics rates are normally included irrespective<br />
of the scope. Data for sub-national segmentseither<br />
geographic or ethnic components-are shown in<br />
smaller-type size for easy identification.<br />
Limitations: Comparability of population estimates is limited<br />
by the factors set forth on p. 15, namely by the variation<br />
in the meaning attached to the terms de jure and de<br />
facto in defining the total count, by the accuracy of the<br />
census on which many estimates are based, and by the<br />
method of estimate construction.<br />
As pointed out in the general notes above, the code<br />
used to describe the method of construction, and hence<br />
the quality of the 1956 estimates, is not strictly applicable<br />
to estimates other than those for that year. Nevertheless,<br />
since countries tend to maintain the same procedures, it<br />
may be assumed that estimates for previous years were<br />
probably produced by the same or similar method. 13<br />
However, it must also be pointed out that when estimates<br />
are based on a census, the longer the post-censal period,<br />
the less accurate the estimates tend to be.<br />
Intercensal estimates are usually reviewed when the results<br />
of a new census become available. Failure to do so<br />
results in lack of comparability in the series. However,<br />
in a number of cases the results of censuses taken in 1955<br />
and 1956 are still in a preliminary stage, and intercensal<br />
estimates have not yet been revised and brought into<br />
agreement with the new population counts. In some of<br />
these series, the need for revision is obvious; in others,<br />
only minor fluctuations are evident in the unrevised data.<br />
Series which show an irregularity of this type are marked<br />
with a section mark (§) in the stub and a vertical bar<br />
(I) at the break in continuity.<br />
13 See 1956 Demographic Yearbook beginning on p. II for analysis<br />
of method used in producing 1955 estimates.


