

1957 - United Nations Statistics Division
1957 - United Nations Statistics Division
1957 - United Nations Statistics Division

You also want an ePaper? Increase the reach of your titles
YUMPU automatically turns print PDFs into web optimized ePapers that Google loves.
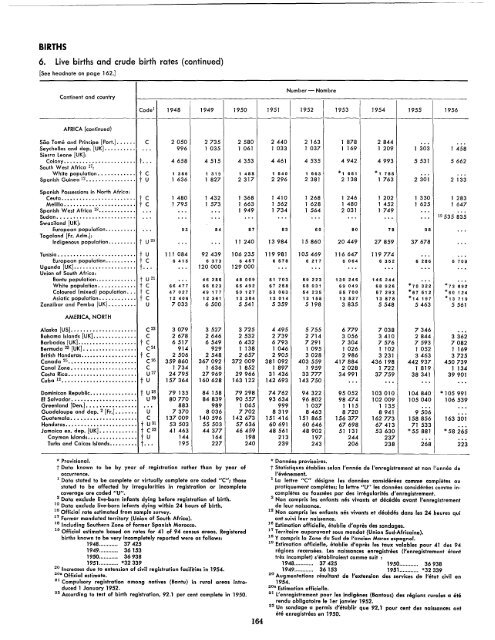
BIRTHS<br />
6. Live births and crude birth rates (continued)<br />
[See headnote on page 162.]<br />
Continent and country<br />
AFRICA (continued)<br />
Number - Nombre<br />
Code 1 1948 1949 1950 1951 1952 1953 1954 1955 1956<br />
Sao Tome and Principe [Porl.] •••••• C 2050 2735 2580 2440 2 163 1 878 2844 ... ...<br />
Seychelles and dep. [UK] ••••.••••. ... 996 1 035 1 061 1 033 1 037 1 169 1 209 1 303 1 458<br />
Sierra leone [UK]:<br />
Colony••••••.•.••••••.••.•••• too . 4658 4515 4353 4461 4535 4942 4993 5531 5662<br />
South West Africa 17:<br />
White population••.••.•••... t C 1 386 1 319 1 488 1 640 1 663 * 1 681 * 1 785 ... ...<br />
Spanish Guinea 12 •••..••.•..••••. t U 1 636 1 827 2317 2296 2381 2 138 1 763 2301 2 133<br />
Spanish Possessions in North Africa:<br />
Ceuta.••••••••.•.•..•.•...... t C 1480 1432 1 368 1410 1 268 1 246 1 202 1 330 1 283<br />
Melilla ••••.•••••••••••••••••• t C 1 795 1 573 1 663 1 562 1 628 1 480 1 452 1 625 1 647<br />
Spanish West Africa 18.••••••••••. .. . .. . ... 1 949 1734 1 564 2031 1749 ... ...<br />
Sudan••••••.•••••••••••••.•... .. . ... ... '" ... ... ·.. ... ... 19 535 835<br />
Swaziland [UK]:<br />
European population...••••••. .. , 93 84 87 83 60 80 78 98 ...<br />
Togoland [Fr. Adm.]:<br />
Indigenous population..••••.•. t U 20 .. . .. . 11 240 13984 15860 20449 27859 37678 ...<br />
Tunisia ......................... t U 111 084 92 439 106235 119981 105469 116647 119774 ... ·..<br />
European population.•.••.•••• t C 6 415 6 373 6 467 6 678 6 217 6 064 6 352 6 286 5 709<br />
Uganda [UK] •••..••••••••.•••••. too . .. . 120000 129000 ... ... · " '" ... ·..<br />
Unian of South Africa:<br />
Bantu population•••••••••.•.. t U 21 .. . 46 286 48 009 51 703 69 223 130246 146244 ... ·..<br />
White population..•••.•••••• t C 66 477 66 623 65 492 67 258 68 031 69 049 68 926 *70322 *73892<br />
Coloured (mixed) population... t C 47 027 49 177 50 127 53 063 54 235 55 700 67 293 *67612 * 60 124<br />
Asiatic population•.•.•.••••.• t C 12 406 12 361 13 384 13 014 13 165 13 627 13 878 * 14 197 * 13 719<br />
Zanzibar and Pembo [UK] •••.••••. U 7033 6500 5541 5359 5198 3835 5548 5463 5561<br />
AMERICA, NORTH<br />
Alaska [US] ••••••••••••••••••••• C 22 3079 3527 3725 4495 5755 6779 7038 7346 ...<br />
Bahama Islands [UK].............. C 2678 2646 2532 2739 2714 3056 3410 2844 3362<br />
Barbados [UK] ••••••••••••••••••• t C 6517 6549 6432 6793 7291 7304 7576 7593 7082<br />
Bermud a 23 [UK] ••••••••••••••••• C24 914 929 1 138 1046 1095 1 026 1 102 1 052 1 169<br />
British Honduras.................. t C 2506 2548 2657 2905 3028 2986 3231 3463 3725<br />
Canada 25 .••••••••••••••••••••. C 26 359860 367092 372009 381 092 403559 417884 436 198 442937 450739<br />
Conal Zone ••••••••••••••••.•••• C 1 734 1 636 1 852 1 897 1 959 2028 1 722 1 819 1 134<br />
Costa Rica •••••••••••••••••••••• U 27 24795 27969 29966 31 436 33777 34991 37759 38341 39901<br />
Cuba 12•••••••••••••••••••••••• t U 157364 160 628 163122 142693 143750 ·.. ... . " ...<br />
Dominican Republic••••••••••••••• t U 28 79135 84158 79298 74762 94322 95052 103010 104840 * 105991<br />
EI Salvador••••••••••••••••••••• U 29 80770 84839 90557 93634 96802 98474 102009 105040 106539<br />
Greenland [Den.] •••••••••••••••• .,. 883 989 1 065 999 1 037 1 115 1 135 ... ...<br />
Guadeloupe and dep. 2 [Fr.] ••••••• U 7370 8036 7702 8319 8463 8720 8941 9506 ...<br />
Guatemala••••••••••••••••••••• C 137009 140596 142673 151416 151 865 156377 162773 158856 163301<br />
Honduras••••••••••••••••••••••• t U 31 53503 55503 57636 60691 60646 67698 67413 71 533 ...<br />
Jamaica ex. dep. [UK] •••••••••••• t C 32 41463 44377 46459 48561 48902 51 131 53630 * 55881 * 58265<br />
Cayman Islands•••••••••••••••• t U 144 164 198 213 197 244 237 ... ...<br />
Turks and Caicos Islands••••••••• too. 195 227 240 239 243 206 238 268 223<br />
* Provisional.<br />
t Data known to be by year of registration rather than by year of<br />
occurrence.<br />
1 Data stated to be complete or virtually complete are coded "C"; those<br />
stated to be affected by irregularities in registration or incomplete<br />
coverage are coded I/U".<br />
2 Data exclude live-born ,infants dying before registration of birth.<br />
12 Data exclude live-born infants dying within 24 hours of birth.<br />
16 Official rate estimated from sample survey.<br />
17 Former mandated territory (Un,ion of South Africa).<br />
18 Including Southern Zone of former Spanish Morocco.<br />
19 Official estimate based on rates for 41 of 94 census areas. Registered<br />
births known to be very incompletely reported were as follows:<br />
1948............ 37425<br />
1949............ 36153<br />
1950............ 36938<br />
1951.. *32339<br />
20 Increases due to extension of civil registration facilities in 1954.<br />
20. Official estimate.<br />
21 Compulsory registration among natives (Bantu) in rural areas introduced<br />
1 January 1952.<br />
22 According to test of birth registration, 92.1 per cent complete in 1950.<br />
164<br />
* Donnees provisoires.<br />
t Statistiques etablies selon I'annee de I'enregistrement et non I'annee de<br />
I'evenement.<br />
1 la lettre "c" designe les donnees considerees comme completes au<br />
pratiquement completes; Ie lettre "U" les donnees considerees comme incompletes<br />
au faussees par des irregularites d'enregistrement.<br />
2 Non compris les enfants nes vivants et decedes avant I'enregistrement<br />
de leur naissance.<br />
12 Non compris les enfants nes vivants et decedes dans les 24 heures qui<br />
cnt suivi leur naissance.<br />
16 Estimation officielle, etabUe d'apres des sondages.<br />
17 Territoire auparavant sous mandat (Union Sud-Africaine).<br />
18 Y compris la Zone du Sud de !'ancien Maroc espagnol.<br />
19 Estimation officielle, etablie d'apres les taux valables pour 41 des 94<br />
regions recensees. Les naissances enreg,isfrees ()'enregistrement afent<br />
tres incomplet) s'etabliraient comme suit:<br />
1948............ 37425 1950............ 36938<br />
1949............ 36153 1951.. *32339<br />
20 Augmentations resultant de I'extension des services de I'etat civil en<br />
1954.<br />
20. Estimation officielle.<br />
21 l'enregistrement pour les indigenes (Bantous) des regions rurales a ete<br />
rendu obligatoire Ie ler janvier 1952.<br />
22 Un sandage a permis d'etablir que 92,1 pour cent des naissances ant<br />
ete enregistrees en 1950.


